Not sure how much of an edge case this is or if it has been discussed.
Use Case: Creating a flask Web app and looking and intergrating certain plots. In some cases I am using bokeh.embed.server_document to embed full panel apps but in some cases (pure viz) I feel this is a bit of a over kill and was looking at just rendering the bokeh plots statically.
My data is in Xarray but that is minor.
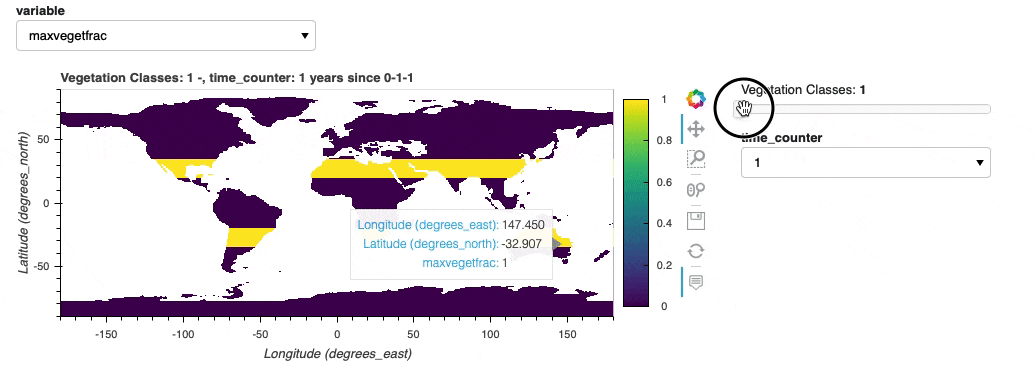
A panel implementation looks like this:
import xarray as xr #Used to handle netCDF fiels
import hvplot.xarray # Add interactive plotting through holoviz ecosystem to xarray

# Panel is holoviz tool for "dashboarding" here we use the "interact" function which builds stuff intelligently
from panel.interact import interact
dss = xr.open_dataset(...)
def plot(variable):
    return dss[variable].hvplot.image().opts(cmap='viridis')
interact(plot, variable = list(dss.data_vars))
This is great but requires the python Backend. The advantage / what I am hoping to gain going via holoviews is all the nice extras you add to bokeh (handling multiple coordinates on right hand side):
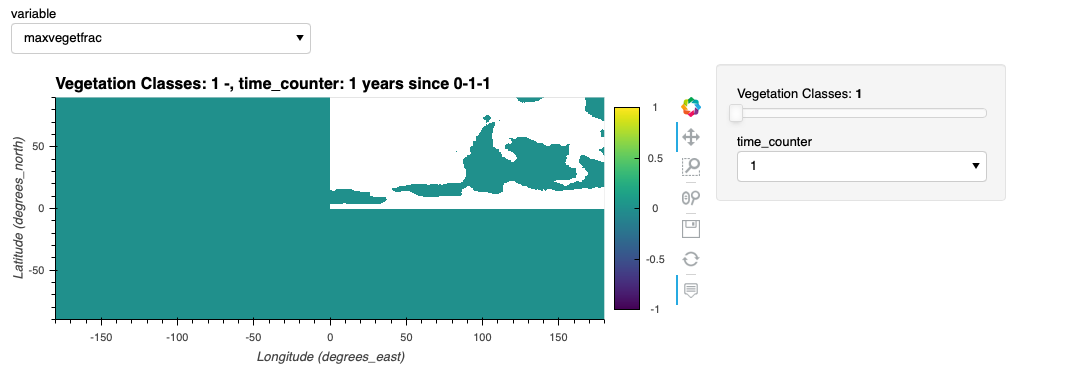
For reference for anyone reading this thread a basic variable changer in bokeh would look like this and kinda shows it is possible to change variables statically (not sure about data limits / more technical problems):
    ds = xr.open_dataset(...)
    d = {} # Create a dict to hold values
    for data_var in ds.data_vars:
        d[data_var] = [ds[data_var].values] # read vars into dict can probably do this more efficiently
    d['to_plot'] = [ds[list(ds.data_vars)[0]].values] # Set the variable that will be plotted
    source = ColumnDataSource(d) # Create the data source that the image will use

    # Create a custom callback which when the selector changes value we
    # read the values of the given data into the plotting variable
    callback = CustomJS(args=dict(source=source), code = """
        var data = source.data;
        data['to_plot'] = data[cb_obj.value];
        source.change.emit();
    """)
    # Create a selector tool
    select = Select(title="Variable:", options=list(ds.data_vars))
   # Add js call back
    select.js_on_change('value', callback)

    # This creates a holoviews plot and converts to bokeh but
    # not sure it how to update the data source??
    #plot = ds.hvplot.image().opts(responsive=True)
    #plot = hv.render(plot, backend="bokeh")

    # Create the figure
    p = Figure(x_range=(0, 1000), y_range=(0, 1000))
    # Plot the data (when the selector changes to "to_plot" variable is updated
    p.image(image='to_plot', x=0, y=0, dw=1000, dh=1000, source=source)

    # Generate script and div to insert into Jinja template
    script, div = components(column(select, p))