I have an app with streaming data displayed in a scatter plot using hv.DynamicMap. The y data of the scatter is in units of J/mol, but I’d like the users to interact with the data in units of kJ/mol.
Currently I’m rescaling the data with a factor 1e3 before plotting it. The data is plotted with a colormap so I’m also rescaling the clim opt.
However, in other parts of the app I’m also using the same data and colormap and as a consequence the step of rescaling appears in many parts of my app.
I’m trying to rescale/transform the data just before plotting such as described in this hvplot issue here.
How can I do the equivalent thing in HoloViews? I’ve been playing with hv.dim but I seem to be unable to get that to work.
Also, it it possible to somehow pass the norm object to opts directly instead of clim ?
MWE of what I’m currently doing with rescaling:
import holoviews as hv
import numpy as np
import pandas as pd
import panel as pn
from functools import partial
import param
from holoviews.streams import Pipe
from matplotlib.colors import Normalize

hv.extension('bokeh')

class Controls(param.Parameterized):
    cmap = param.Selector(default='turbo', objects=['turbo', 'inferno', 'viridis'])

x = np.arange(50)
y = 10000*(np.random.rand(50)+0.2)
sclf = 1e-3

df = pd.DataFrame({'x': x, 'y': y*sclf})

ymin, ymax = 2000, 12000
norm = Normalize(vmin=ymin, vmax=ymax)
clim = (norm.vmin*sclf, norm.vmax*sclf)

stream = Pipe(data=df)
controls = Controls()

func = partial(hv.Scatter, kdims=[None, 'y'])
plot = hv.DynamicMap(hv.Scatter, streams=[stream])
transform = {'y': hv.dim('y')*1e-3}
s = plot.apply.opts(cmap=controls.param['cmap'], color='y', clim=clim, colorbar=True)

hv_pane = pn.pane.HoloViews(s)
app = pn.Row(hv_pane, pn.panel(controls.param.cmap))

app.servable()
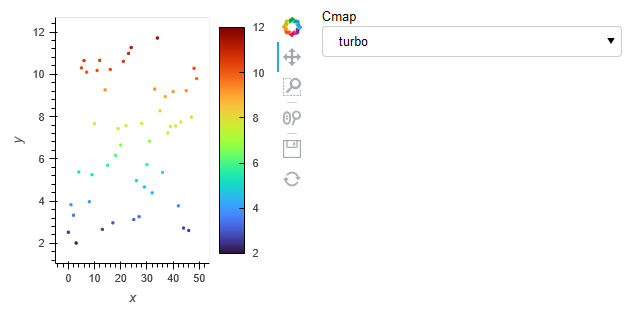
App: