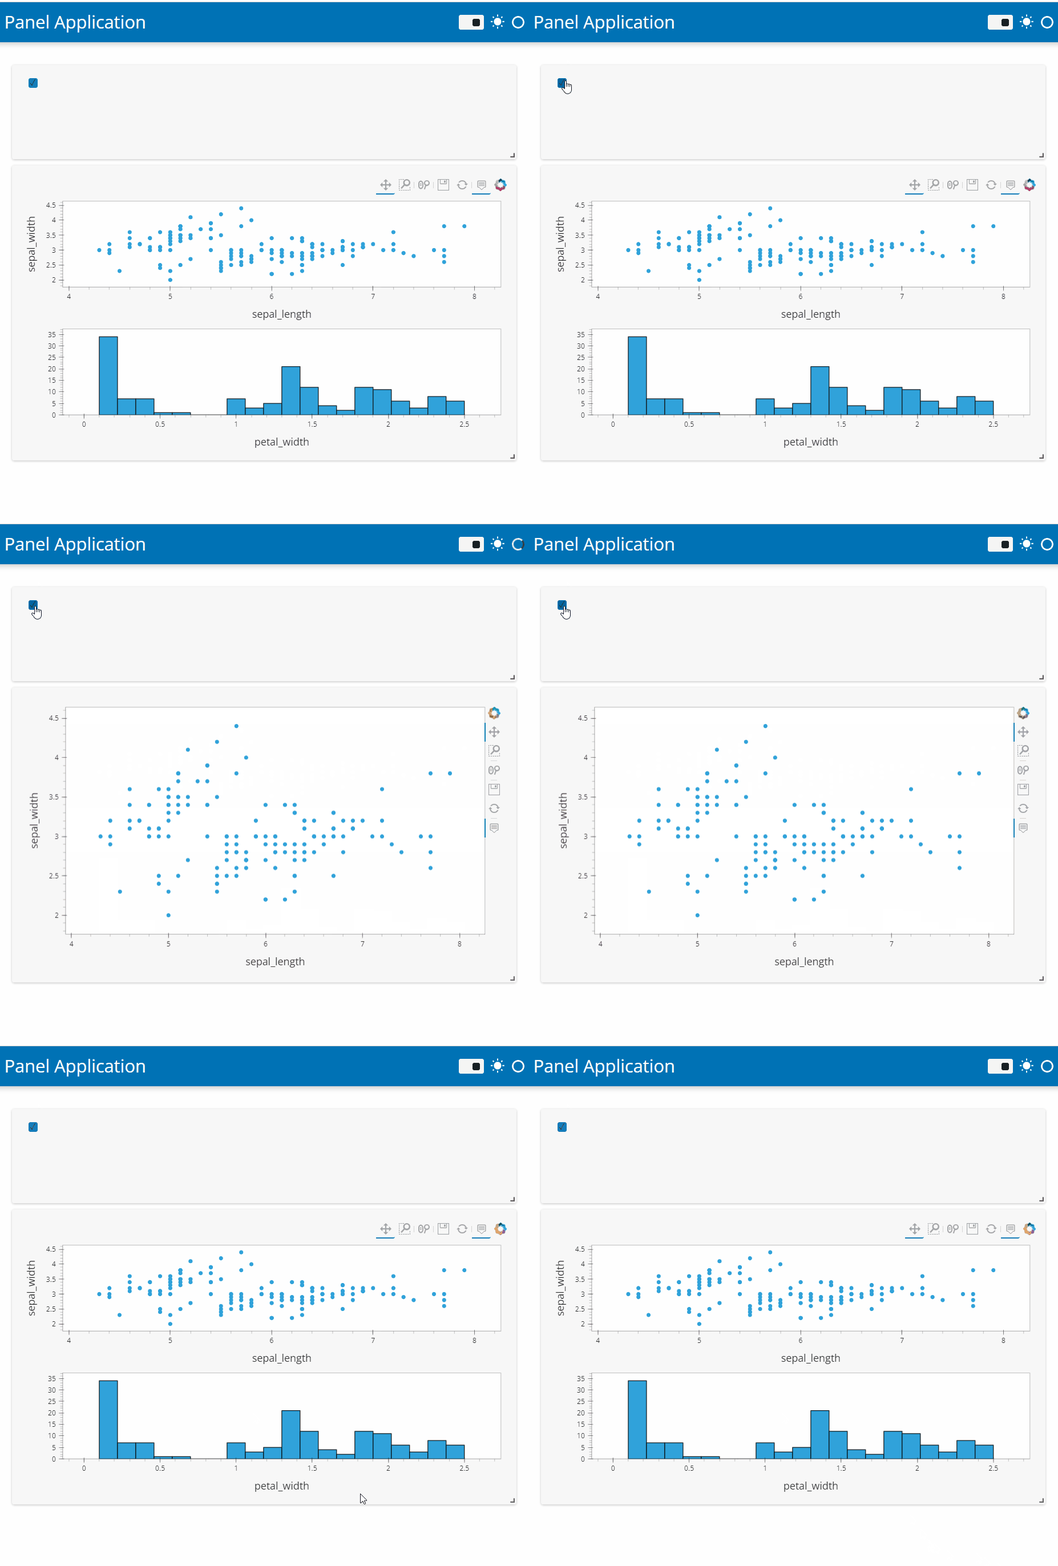
I am trying to build something where the user uses their own data file to plot something, and therefore I can plot anything on load. I would like to use the FastGridTemplate or the React template for the resizability and moving around, but if you say template.main[0:1, :] = plot when plot is empty (to not take up much space), then when it is populated, it doesn’t expand. I know the docs say that you can’t resize the template gridspec after rendering, but if you need a dynamic resizing layout, you should use something like a column or row that resizes and put it in your gridspec. I tried that, and it isn’t working, nomatter where I put sizing_mode=“stretch_whatever” or height_policy=“max” or responzive=True. Is this possible? Am I just doing it wrong?
Here is a simplified example showing my problem.
import holoviews as hv
import hvplot.pandas  # noqa
import panel as pn
from bokeh.sampledata.iris import flowers

pn.extension(sizing_mode="stretch_width")
hv.extension("bokeh")


chbox = pn.widgets.Checkbox()


@pn.depends(chbox)
def get_plots(val):
    scatter = flowers.hvplot.scatter(x="sepal_length", y="sepal_width", responsive=True, height=300)
    hist = flowers.hvplot.hist("petal_width", responsive=True, height=300)

    if val:
        return pn.Column((scatter + hist).cols(1), height_policy="max")
    else:
        return scatter


template = pn.template.FastGridTemplate()
template.main[0:1, :] = chbox
template.main[1:4, :] = get_plots
template.servable()
When you click on the check box the plot box gets a second plot but it doesn’t get taller, so it just adds a scroll bar. Any advice would super be appreciated!!!
