Responsive sizing_mode and pn.depends heatmap rendering with 0 height

This has been driving me crazy for a couple hours now and I just cannot work out what I’m doing wrong or how to make the plot responsive.

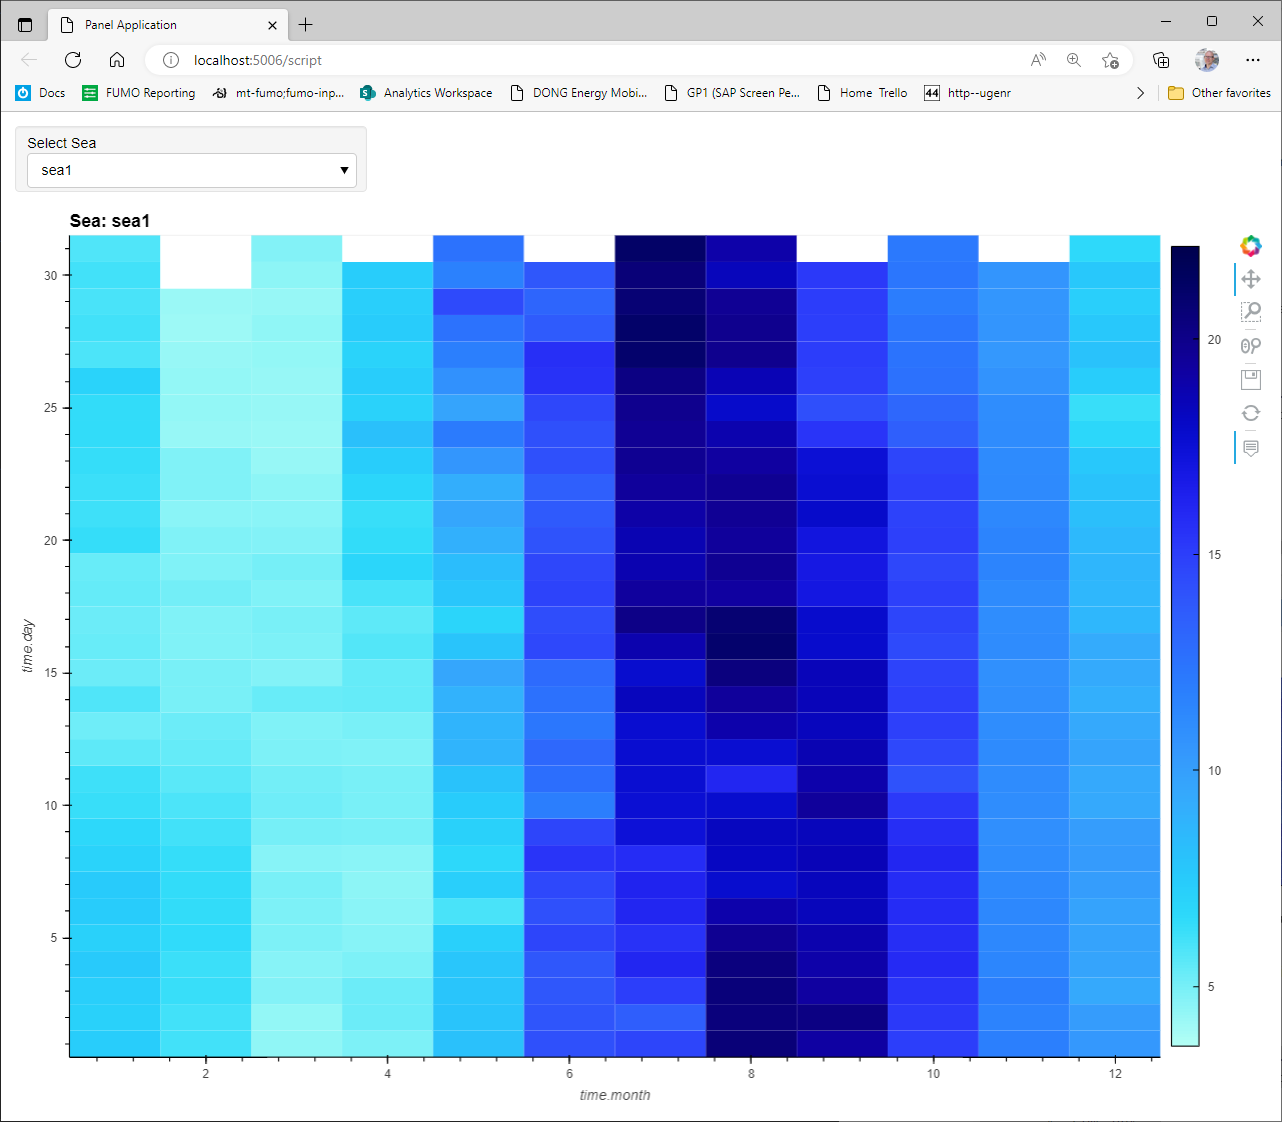
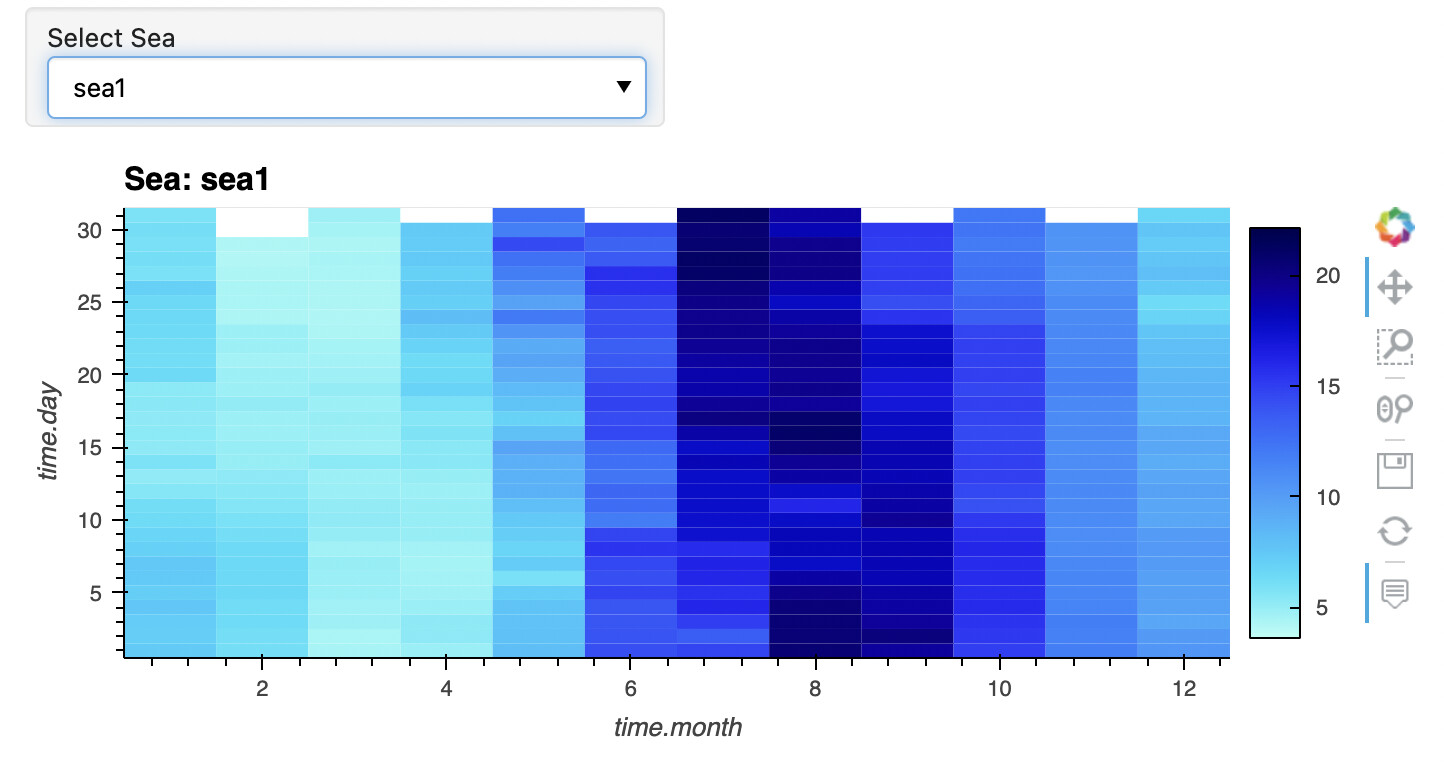
I’m plotting something like the following, which works great and is exactly what I want.

import pandas as pd
import hvplot.pandas
import numpy as np
import panel as pn
from bokeh.sampledata import sea_surface_temperature as sst

df = sst.sea_surface_temperature

df['sea'] = 'sea1'

df2 = df.copy()
df2['sea'] = 'sea2'
df2_temps = df2['temperature'].to_numpy()
rng = np.random.default_rng()
rng.shuffle(df2_temps)
df2['temperature'] = df2_temps

df_plot = pd.concat([df, df2])

group_select = pn.widgets.Select(name='Select Sea', options=df_plot['sea'].unique().tolist(), value='sea1')

@pn.depends(group_select)
def get_heatmap(group_select):
    to_plot = df_plot.groupby('sea').get_group(group_select)
    the_plot = to_plot.hvplot.heatmap(
        x='time.month', 
        y='time.day',
        C='temperature',
        title=f"Sea: {group_select}"
    )
    
    return the_plot

pn.Column(pn.WidgetBox(group_select), get_heatmap)

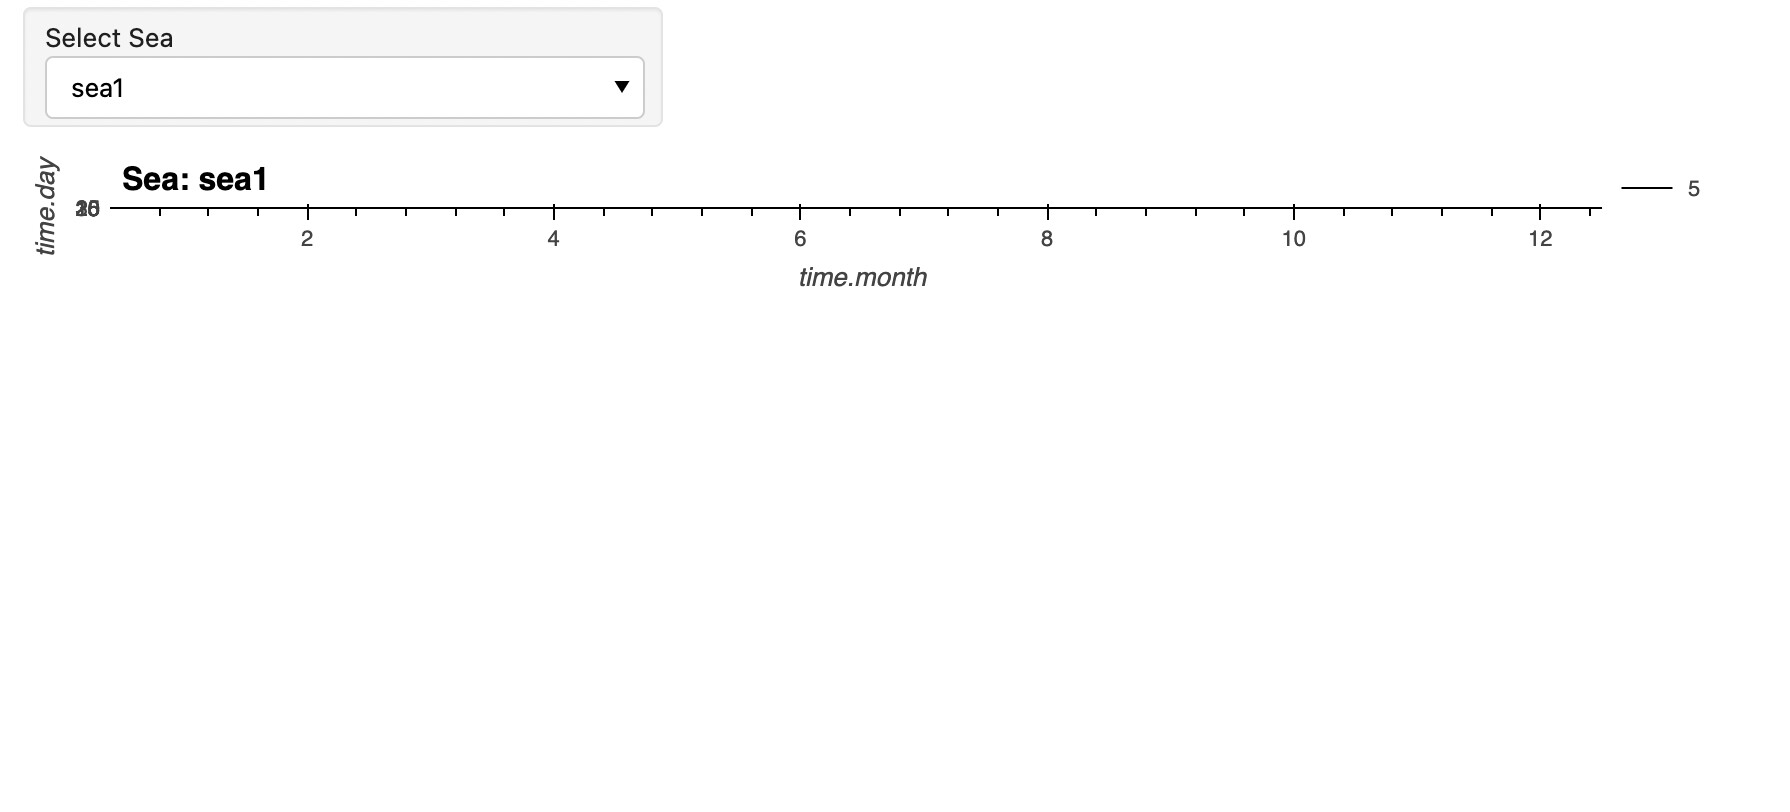
However, I then want to make the plot responsive in size, so I change the following:

@pn.depends(group_select)
def get_heatmap(group_select):
    to_plot = df_plot.groupby('sea').get_group(group_select)
    the_plot = to_plot.hvplot.heatmap(
        x='time.month', 
        y='time.day',
        C='temperature',
        title=f"Sea: {group_select}",
        responsive=True
    )

pn.Column(pn.WidgetBox(group_select), get_heatmap, sizing_mode='stretch_both')

But this produces the heatmap with 0 height:

Which I see both in the notebook and using serve. Even if I give a minimum height to the column it doesn’t fill:

pn.Column(pn.WidgetBox(group_select), get_heatmap, sizing_mode='stretch_both', min_height=400)

I’ve read numerous pages on here and GitHub about the difficulties with resizing but I cannot piece together how to solve this height 0 problem.

The only way I managed to get something reasonable was using GridSpec but then I had trouble with that as eventually this plot will be placed into a GridSpec itself and I was getting strange results.

Does anyone know how to get around this issue? Thanks very much in advance!

Versions:

holoviews          1.15.1
hvplot             0.8.2
panel              0.14.2
param              1.12.3

Hi @DrAstro,

Have you tried setting a min_height to the heatmap itself rather than column? I think that might stop it going flat. Think this is what I might have done but not at the computer just now to firm up

Hope it helps, Carl.

Hi @carl, thanks for your reply. It does indeed stop it going flat if I do that but it doesn’t make it responsive. A min_height=100 will give it that size but it won’t fill the rest of the available area beyond that point unfortunately.

Hi @DrAstro,

Try instead of min_height, aspect=1 or maybe a combination. I was able to get graph to fill page though would put on side scroller and then was responsive to resizing window

Hi @DrAstro

You can also wrap the get_heatmap function in pn.panel with sizing_mode="stretch_both".

Why its needed, I don’t know.

import pandas as pd
import hvplot.pandas
import numpy as np
import panel as pn
from bokeh.sampledata import sea_surface_temperature as sst

df = sst.sea_surface_temperature

df['sea'] = 'sea1'

df2 = df.copy()
df2['sea'] = 'sea2'
df2_temps = df2['temperature'].to_numpy()
rng = np.random.default_rng()
rng.shuffle(df2_temps)
df2['temperature'] = df2_temps

df_plot = pd.concat([df, df2])

group_select = pn.widgets.Select(name='Select Sea', options=df_plot['sea'].unique().tolist(), value='sea1')

@pn.depends(group_select)
def get_heatmap(group_select):
    to_plot = df_plot.groupby('sea').get_group(group_select)
    return to_plot.hvplot.heatmap(
        x='time.month', 
        y='time.day',
        C='temperature',
        title=f"Sea: {group_select}",
        responsive=True
    )

pn.Column(pn.WidgetBox(group_select), pn.panel(get_heatmap, sizing_mode="stretch_both"), sizing_mode='stretch_both').servable()

@philippjfr . Could you explain why its needed?

I reported this as a bug in Issue #4325.

2 Likes

Thanks @carl and for that solution @Marc, I did not stumble across that combination of exactly where to put the panel! Working as intended on my dashboard now!

2 Likes

If you can @DrAstro, please share a screenshot.

I wish I could, unfortunately it’s data I cannot share :pensive:

1 Like