Thanks for the mre
import hvplot.pandas

from bokeh.sampledata.autompg import autompg_clean

autompg_clean.sample(n=5)

plt= autompg_clean.hvplot.hist("weight", normed=True)

plt.range("Frequency")
Should give you what you want.
I discovered “Frequency” by hovering over the bars and that was the vdim.
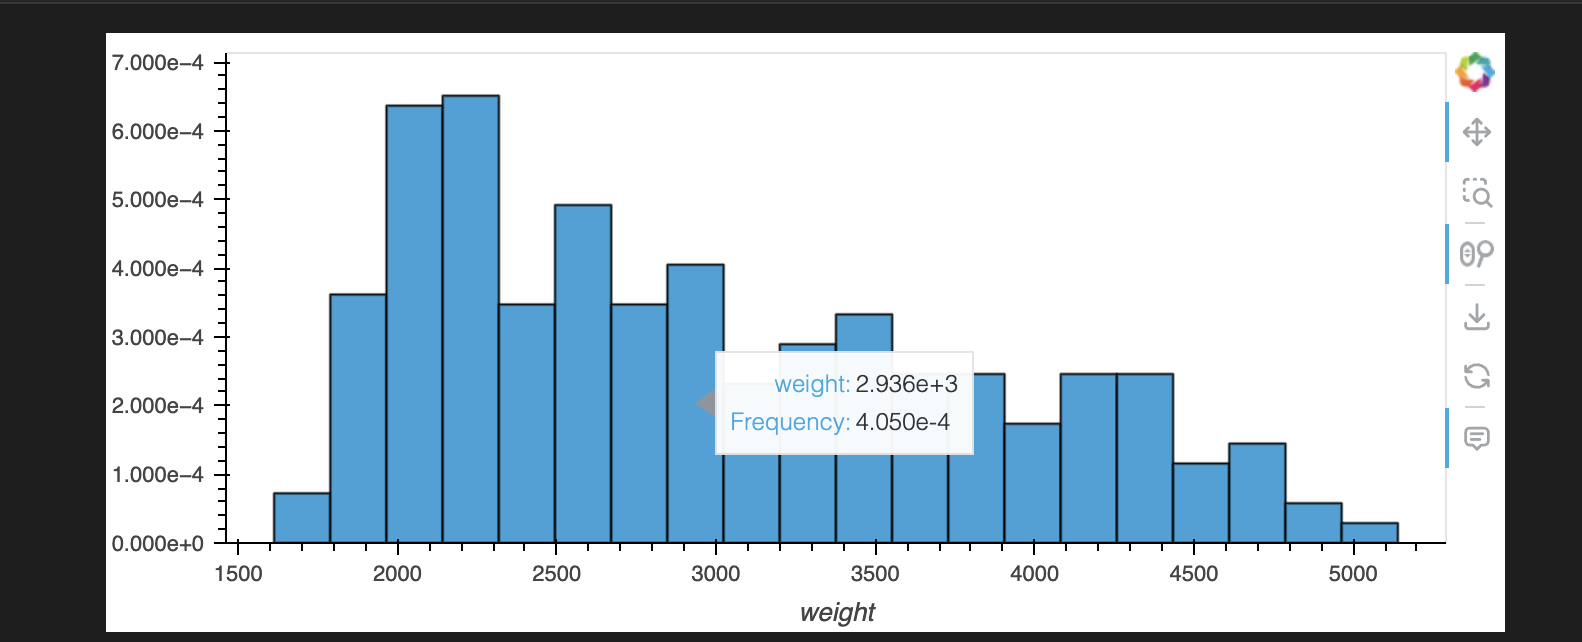
You get the figure ylims by specifying the desired dim, so if you wanted the x-axis for this plot, it’d be plt.range("weight"). I believe it’s case sensitive.