I’m trying to place text on multiple hvplot.hist figures using hv.Text
Since these are normalized histograms I’m not sure how to automatically determine the y-position.
How can I acquire the axes (specifically, the max y value) from the current histogram so the correct y-position can be assigned?
Or perhaps there some option for relative positioning in hv.Text, however I found nothing obvious in the Bokeh help.
You could use a stream to continuously update the label location;
https://holoviews.org/reference/streams/bokeh/RangeXY.html
Bokeh screen units:
from bokeh.plotting import figure, show
from bokeh.models import Label

fig = figure(title='Label position test')

fig.circle([1, 2, 3, 4, 5], [6, 7, 2, 4, 5], size=20, color="navy", alpha=0.5,)

lower_left = Label(x=5, y=5, x_units='screen', y_units='screen', text='Lower left corner')
fig.add_layout(lower_left)

show(fig)
Raised an issue here: hv.Text and hv.Labels should support `x_units` and `y_units` · Issue #6184 · holoviz/holoviews · GitHub
Let me know if you’d like to contribute a PR to fix it!
Thanks. It seems like relative positioning is not yet an option for hv.Text.
What about the option to simply inspect the hvplot.hist plot object to get the current axes?
I’m accustomed to doing this in matplotlib with ax.get_ylim(). Is there an equivalent here?
plot.range('your_dimension_name') maybe
Using plot.range(‘ylim’) for my histogram returns (None,None).
If I use it for the parameter plotted in the histogram it gives the correct values. I’m not sure how to get the ylims of the normalized histogram values.
I’m only trying to acquire this for a static histogram plot, not dynamically (no zooming).
Can you provide a minimal reproducible example? Not entirely sure about the context.
import hvplot.pandas
from bokeh.sampledata.autompg import autompg_clean
autompg_clean.sample(n=5)
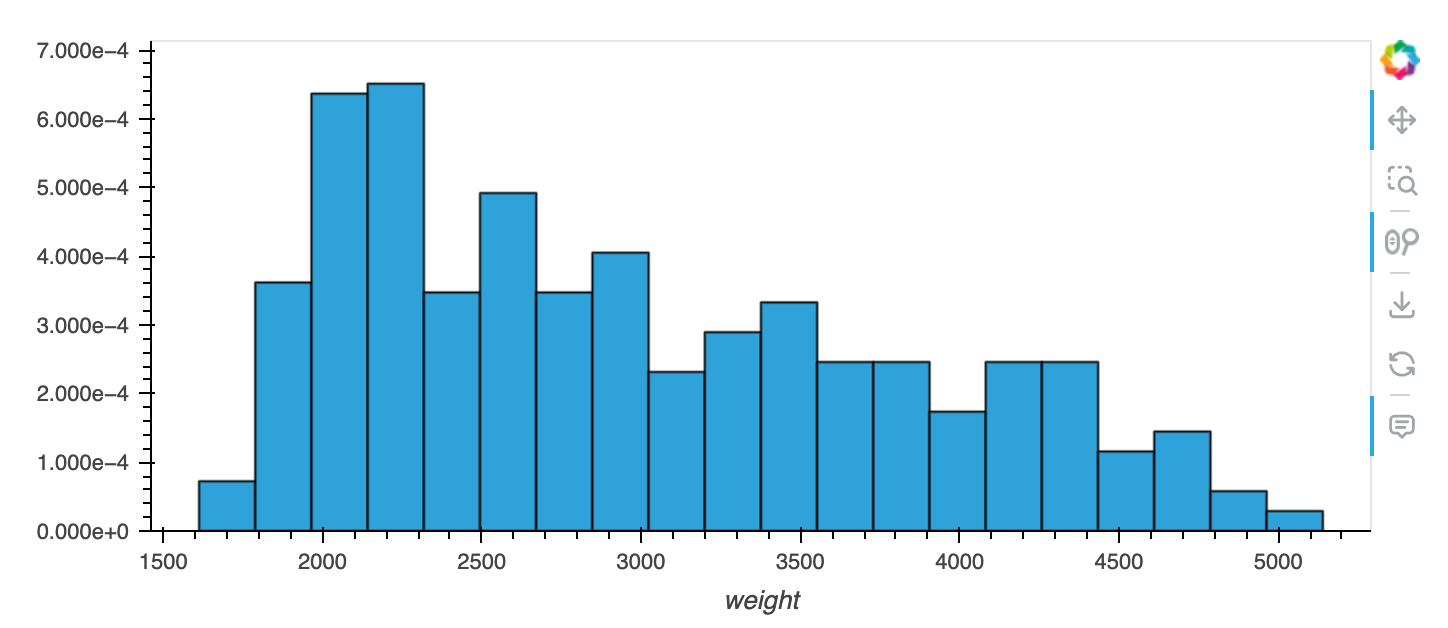
plt= autompg_clean.hvplot.hist(“weight”,normed=True)
plt.range(‘ylim’)
returns …
(None, None)
Wanting (0, 0.0007) for this example.
In general, how do I get the figure ylims for any such plot???
Thanks for the mre
import hvplot.pandas
from bokeh.sampledata.autompg import autompg_clean
autompg_clean.sample(n=5)
plt= autompg_clean.hvplot.hist("weight", normed=True)
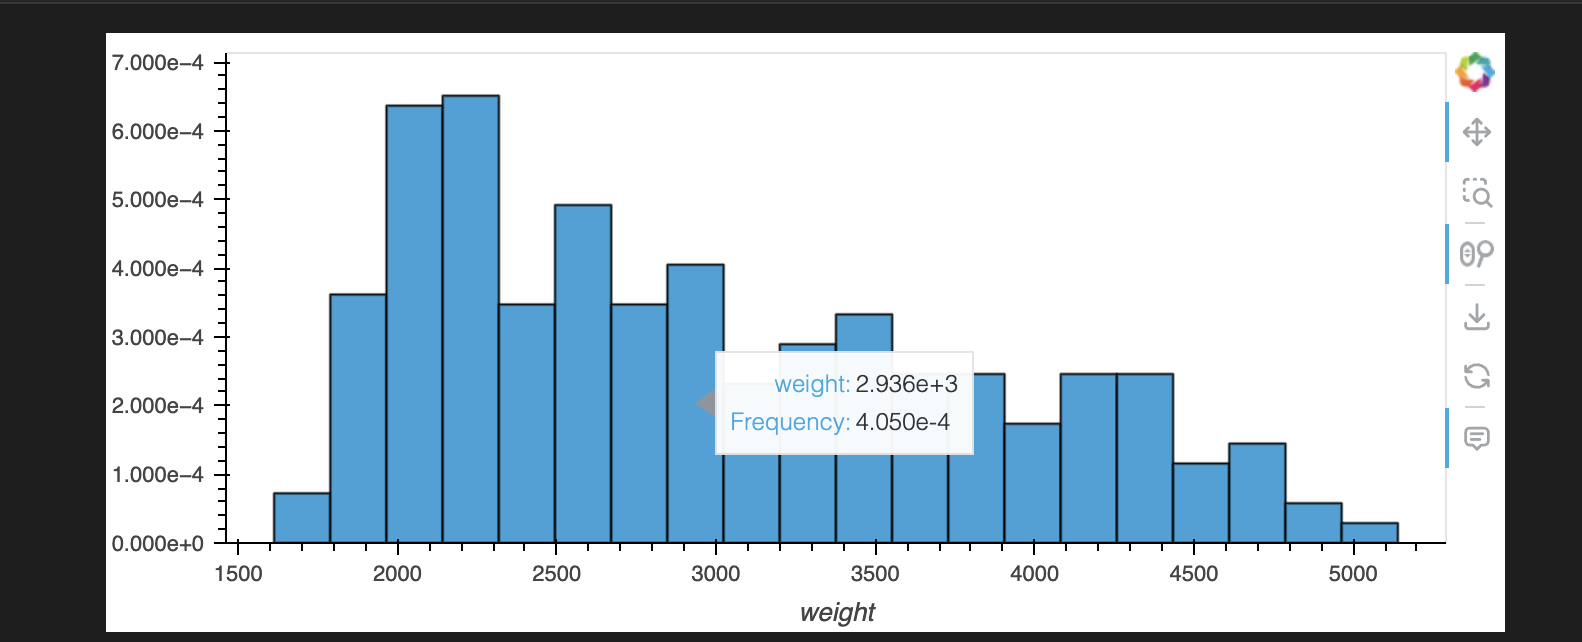
plt.range("Frequency")
Should give you what you want.
I discovered “Frequency” by hovering over the bars and that was the vdim.
You get the figure ylims by specifying the desired dim, so if you wanted the x-axis for this plot, it’d be plt.range("weight"). I believe it’s case sensitive.