Round value from PointDraw

Hi,
I am trying to round the decimals for points created using the PointDraw stream.
Unforfunately, I am unable to do so.

Considering the following example, how can we round the points created using the PointDraw so that they appear with a given decimal precision in the table (in my case 1 or 2 decimals)?

import holoviews as hv
import panel as pn
import param
from holoviews import opts, streams
from holoviews.plotting.links import DataLink

hv.extension("bokeh")


class App(param.Parameterized):
    data = param.Parameter()

    def __init__(self, **params):
        super().__init__(**params)
        self.data = ([0, 0.5, 1], [0, 0.5, 0], ["red", "green", "blue"])
        self.points = hv.Points(self.data, vdims="color").redim.range(x=(-0.1, 1.1), y=(-0.1, 1.1))
        self.point_stream = streams.PointDraw(
            data=self.points.columns(), num_objects=10, source=self.points, empty_value="black"
        )
        self.table = hv.Table(self.points, ["x", "y"], "color")

        DataLink(self.points, self.table)

    @param.depends("point_stream.data", watch=True)
    def transform_data(self):
        pass

    def view(self):
        layout = (self.points + self.table).opts(
            opts.Layout(merge_tools=False),
            opts.Points(active_tools=["point_draw"], color="color", height=400, size=10, tools=["hover"], width=400),
            opts.Table(editable=True),
        )

        return pn.Column(layout)


app = App()
app.view().servable()

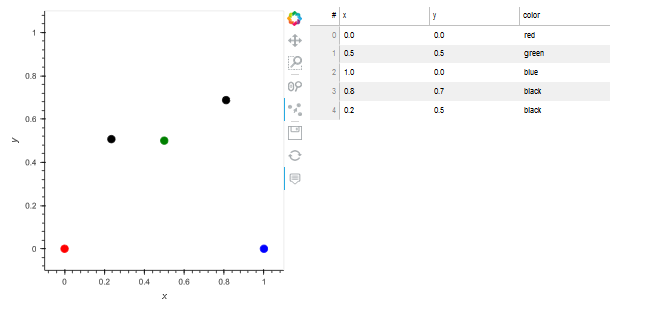
Screenshot before adding a point:

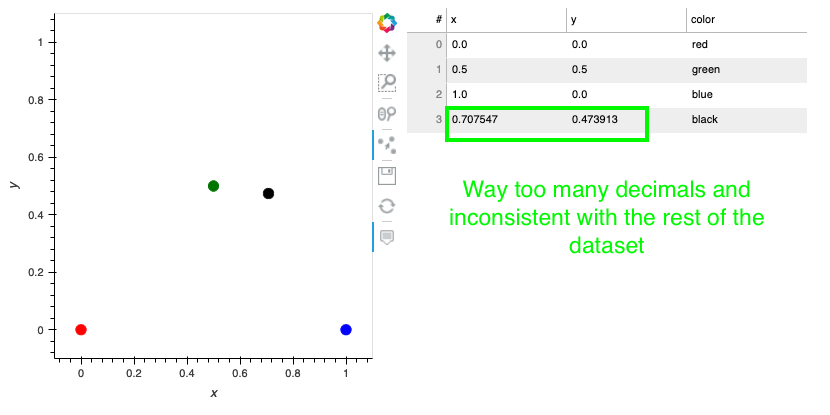
Screenshot after adding a point, notice the decimals:

Thanks in advance for your help.

You can use a formatting hook for the table to accomplish this:

import holoviews as hv
import panel as pn
import param
from holoviews import opts, streams
from holoviews.plotting.links import DataLink
from bokeh.models.widgets import NumberFormatter

hv.extension("bokeh")

def table_formatter(plot, element):
    plot.handles['table'].columns[0].formatter = NumberFormatter(format='0,0.0')
    plot.handles['table'].columns[1].formatter = NumberFormatter(format='0,0.0')

class App(param.Parameterized):
    data = param.Parameter()

    def __init__(self, **params):
        super().__init__(**params)
        self.data = ([0, 0.5, 1], [0, 0.5, 0], ["red", "green", "blue"])
        self.points = hv.Points(self.data, vdims="color").redim.range(x=(-0.1, 1.1), y=(-0.1, 1.1))
        self.point_stream = streams.PointDraw(
            data=self.points.columns(), num_objects=10, source=self.points, empty_value="black"
        )
        self.table = hv.Table(self.points, ["x", "y"], "color")

        DataLink(self.points, self.table)

    @param.depends("point_stream.data", watch=True)
    def transform_data(self):
        pass

    def view(self):
        layout = (self.points + self.table).opts(
            opts.Layout(merge_tools=False),
            opts.Points(active_tools=["point_draw"], color="color", height=400, size=10, tools=["hover"], width=400),
            opts.Table(editable=True, hooks=[table_formatter]),
        )

        return pn.Column(layout)


app = App()
app.view().servable()

08.04.2022_09.22.42_REC

Thanks for the answer. This indeed helps to hide the extra decimals upon reading the table. However, when you click on the cell, all the decimals are shown again.

I guess I’m unclear, then. Do you want to actually modify the values upon adding a point in self.scatter, such that x and y are rounded to a certain number of decimals? Or do you just want the table only show a certain number of decimals, while maintaining the true values of the scatter plot (which is what the current answer achieves)? My understanding is that with the DataLink that you have defined, the values in your table and the values in the plot are linked to one another, so you would have to directly modify the values added by point_draw to prevent these additional decimals in the table. A third option would be to not use DataLink and write a function that reactively renders a table with the rounded values whenever point_draw.data is changed, which would allow you to maintain the float precision in self.scatter while modifying the float precision for the table.

Hopefully this is helpful!

2 Likes

Hi,
Thanks for your answer and apologies for the late reply. Yes what I’m looking for a way to round the data (not just for display) when a point is added or dragged on the plot via point_draw and reflect the change in the table, and allow also to edit the data in the table and reflect the changes in the plot.

I’m developing an web app in my company based on Panel and Holoview and three of the constrains are:

  • to be able to fine tune the data points via both a plot and a table;
  • to automatically round the value to a meaningful decimal. In the domain this app will be used for, anything beyond the second decimal is not only meaningless but as well wrong from an engineering point of view;
  • sort them by the y axis automatically (because the points have only a meaning when sorted according to the y axis in this case).

I previously tried to do a two way editing between a Holoview plot and Panel Tabulator instance, with rounding the value (and sorting according to the y axis) as an intermediary step, but I could not find a proper way to do so without getting an error from Bokeh stating that the model was out of sync (I would need to find back the real error message but that’s the way I understood it).

Here is a link to the previous attempt:

Alrighty… I have spent quite a bit of time on this and I can’t come up with a perfect solution for you. The following code achieves what you want from a rounding of values perspective. However, adding additional vdims (e.g., color) causes the kernel to crash… which I suspect is either a bug or me not fully understanding how PointDraw works.

import holoviews as hv
import panel as pn
import param
from holoviews import opts, streams, dim
from holoviews.plotting.links import DataLink

hv.extension("bokeh")

class App(param.Parameterized):
    data = param.Parameter()
    point_stream = param.ClassSelector(default = streams.PointDraw(num_objects=10, empty_value="black"), class_=(streams.PointDraw))
    
    def __init__(self, **params):
        super().__init__(**params)
        self.data = dict(zip(['x', 'y', 'color'], ([0, 0.5, 1], [0, 0.5, 0], ["red", "green", "blue"])))
        self.point_stream.update(data=self.data)
    
    @param.depends('point_stream.data')
    def view(self):
        self.point_stream.data['x'] = [round(i, 2) for i in self.point_stream.data['x']]
        self.point_stream.data['y'] = [round(i, 2) for i in self.point_stream.data['y']]
        
        self.points = hv.Points(self.point_stream.data, ['x', 'y'])
        self.table = hv.Table(self.points, ["x", "y"])
        self.point_stream.source = self.points
        
        DataLink(self.points, self.table)
        
        layout = (self.points + self.table).opts(
            opts.Layout(merge_tools=False),
            opts.Points(active_tools=["point_draw"], height=400, size=10, tools=["hover"], width=400),
            opts.Table(editable=True),
        )

        return pn.Column(layout)
    
app = App()
pn.Column(app.view)

Sorry I can’t be of more help–perhaps one of the lead developers might have an idea as to why adding vdims here fails.

My initial instinct was to use a DynamicMap with streams=[self.point_stream.param.data], but this also causes the kernel to crash when the returned plot includes vdims.

1 Like

Thanks a lot for your time and help. I will try to implement your example soon (I’m away from work this week).