Save constant determined from a Panel widget using server

I have a matplotlib figure defined:

def cbw_int_plot(CBW_Int):
fig=plt.figure(figsize=(6,6))
plt.title(‘Vsh vs.CBWa’, color = ‘blue’)
#if Sw_quick(m_cem,n_sat,Rw) > 0.8:
plt.plot(logs.vsh,logs.CBWa,‘r.’, label=‘’,color=‘red’)
#plt.plot(logs.vsh,logs.vsh*CBW_Int,‘k-’, label=‘’,color=‘black’)
plt.plot(np.arange(10), np.arange(10) * CBW_Int, “k-”, label=“”)
plt.xlim(0.0,1)
plt.ylim(0.0,1.0)
plt.ylabel(‘CBWa [v/v]’, color = ‘blue’)
plt.xlabel(‘Vsh [v/v]’, color = ‘blue’)
#plt.grid(True, which=‘both’,ls=‘-’,color=‘gray’)
plt.grid()

return fig

and if I use Panel in a Jupyter Notebook, I can retrieve the value of CBW_Int with no problems. The code is shown below:

CBW_Int_slider = pn.widgets.FloatSlider(name=‘CBW_Intercept’,start=0,end=0.5,step=0.01,value=0.5)

pn.interact(cbw_int_plot, CBW_Int = CBW_Int_slider)

CBW_Int = CBW_Int_slider.value

This works perfect.

However, in my primary application I need to use the server version as shown below. With my code I cannot obtain the value of CBW_Int. Can you suggest a revision to this code so that I can obtain the CBW_Int value obtained from the Panel widget?

CBW_Int_slider = pn.widgets.FloatSlider(name=‘CBW_Intercept’,start=0,end=0.5,step=0.01,value=0.5)

def button_callback(event):
global CBW_Int
CBW_Int = CBW_Int_slider.value
pn.io.serve(pn).stop()

button = Button(label=“Stop”, button_type=“success”)
button.on_click(button_callback)

pane = pn.interact(cbw_int_plot, CBW_Int = CBW_Int_slider)

def app():

return pn.Row(pn.Column( button, pane[0], width=350, sizing_mode="fixed"), pn.layout.VSpacer(width=10),pane[1])

server = pn.serve({“localhost:”: app}, port=5006)
Hi @Philliec459

Could you provide a fully working example? I.e a minimum, reproducible example. It will make it much easier to find the issue.

Thanks

Hi Marc,

This is a simple example where I am just plotting a fit line in a cross plot from panel server. The fit line is the product of the cbw_int.

#######################################################
import numpy as np
import pandas as pd
import matplotlib.pyplot as plt
import matplotlib
matplotlib.use(‘Agg’)

import panel as pn
pn.extension()

pn.extension(sizing_mode=“stretch_width”)

#from bokeh.models.formatters import PrintfTickFormatter
from bokeh.models.widgets import Button

import sys

def cbw_int_plot(cbw_int):
fig=plt.figure(figsize=(6,6))
plt.title(‘Vsh vs.CBWa’, color = ‘blue’)
#if Sw_quick(m_cem,n_sat,Rw) > 0.8:
#plt.plot(logs.VSH,logs.CBWa,‘r.’)
#plt.plot(logs.vsh,logs.vsh*CBW_Int,‘k-’, label=‘’,color=‘black’)
plt.plot(np.arange(10), np.arange(10) * cbw_int, “k-”, label=“”)
plt.xlim(0.0,1)
plt.ylim(0.0,1.0)
plt.ylabel(‘CBWa [v/v]’, color = ‘blue’)
plt.xlabel(‘Vsh [v/v]’, color = ‘blue’)
#plt.grid(True, which=‘both’,ls=‘-’,color=‘gray’)
plt.grid()

return fig

‘’’
This is the Panel version
‘’’

cbw_int = 0.2

CBW_Int_slider = pn.widgets.FloatSlider(name=‘CBW_Intercept’,start=0,end=0.5,step=0.01,value=cbw_int)

pane = pn.interact(cbw_int_plot, cbw_int = CBW_Int_slider)

def button_callback(event):
global CBW_Int

CBW_Int = CBW_Int_slider.value

pn.io.serve(pn).stop()
#sys.exit()  # Stop the server

Button to stop the server

button = Button(label=“Stop”, button_type=“success”)
button.on_click(button_callback)

def app():

return pn.Row(pn.Column( button, pane[0],width=350,height=350, sizing_mode="fixed"), pn.layout.VSpacer(width=10),pane[1])

pn.serve({“localhost:”: app}, port=5006)

#####################################################

#####################################################

in another cell:

print(cbw_int)
#####################################################

After displaying the crossplot widget, I just want to somehow save the cbw_int constant that was derived from the cross plot fitting of the data.

I have developed a workaround to save my CBW_Int by saving it as a constant to the file when I click the Stop button. There must be a way to save the value CBW_Int derived from the server widget, but this will have to suffice for now.

import numpy as np
import pandas as pd
import matplotlib.pyplot as plt
import matplotlib
matplotlib.use(‘Agg’)

import panel as pn
pn.extension()

pn.extension(sizing_mode=“stretch_width”)

#from bokeh.models.formatters import PrintfTickFormatter
from bokeh.models.widgets import Button

import sys

def cbw_int_plot(cbw_int):

fig=plt.figure(figsize=(6,6))
plt.title('Vsh vs.CBWa', color = 'blue')
#if Sw_quick(m_cem,n_sat,Rw) > 0.8:
#plt.plot(logs.VSH,logs.CBWa,'r.')
#plt.plot(logs.vsh,logs.vsh*CBW_Int,'k-', label='',color='black')
plt.plot(np.arange(10), np.arange(10) * cbw_int, "k-", label="")
plt.xlim(0.0,1)
plt.ylim(0.0,1.0)
plt.ylabel('CBWa [v/v]', color = 'blue')
plt.xlabel('Vsh [v/v]', color = 'blue')
#plt.grid(True, which='both',ls='-',color='gray')
plt.grid()

return fig

‘’’
This is the Panel version
‘’’

cbw_int = 0.2

CBW_Int_slider = pn.widgets.FloatSlider(name=‘CBW_Intercept’,start=0,end=0.5,step=0.01,value=cbw_int)

pane = pn.interact(cbw_int_plot, cbw_int = CBW_Int_slider)

def button_callback(event):
global CBW_Int

CBW_Int = CBW_Int_slider.value

**# Save the new CBW_Int value to a file**

** with open(“new_cbw_int.txt”, “w”) as f:**
** f.write(str(CBW_Int))**

pn.io.serve(pn).stop()
#sys.exit()  # Stop the server

Button to stop the server

button = Button(label=“Stop”, button_type=“success”)
button.on_click(button_callback)

def app():

return pn.Row(pn.Column( button, pane[0],width=350,height=350, sizing_mode="fixed"), pn.layout.VSpacer(width=10),pane[1])

pn.serve({“localhost:”: app}, port=5006)

print(cbw_int)

Hi @Philliec459, could you try to better format your posts and code blocks in particular? They’re a bit difficult to read at the moment.

This is how you should wrap your code:

```python
# a comment
print('hello world')
```

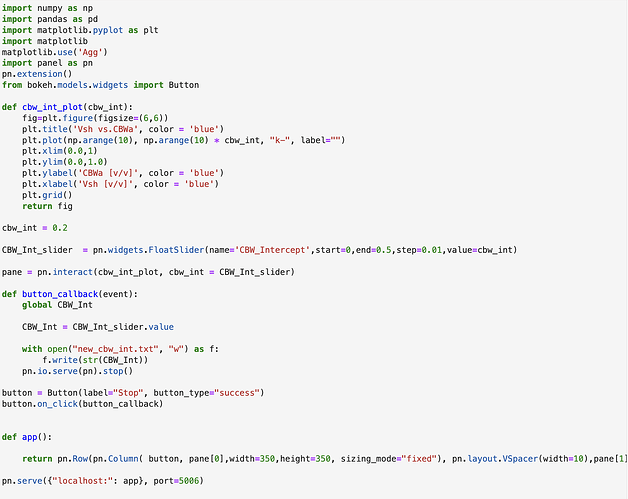
I noticed this as I copy and paste into this reply panel. For a starter here is an image so that you can see the formatting.

I will try your suggestion:

import numpy as np
import pandas as pd
import matplotlib.pyplot as plt
import matplotlib
matplotlib.use('Agg')
import panel as pn
pn.extension()
from bokeh.models.widgets import Button

def cbw_int_plot(cbw_int):
    fig=plt.figure(figsize=(6,6))
    plt.title('Vsh vs.CBWa', color = 'blue')
    plt.plot(np.arange(10), np.arange(10) * cbw_int, "k-", label="")
    plt.xlim(0.0,1)
    plt.ylim(0.0,1.0)
    plt.ylabel('CBWa [v/v]', color = 'blue')
    plt.xlabel('Vsh [v/v]', color = 'blue')
    plt.grid()
    return fig

cbw_int = 0.2

CBW_Int_slider  = pn.widgets.FloatSlider(name='CBW_Intercept',start=0,end=0.5,step=0.01,value=cbw_int)

pane = pn.interact(cbw_int_plot, cbw_int = CBW_Int_slider)

def button_callback(event):
    global CBW_Int

    CBW_Int = CBW_Int_slider.value
    
    with open("new_cbw_int.txt", "w") as f:
        f.write(str(CBW_Int))
    pn.io.serve(pn).stop()

button = Button(label="Stop", button_type="success")
button.on_click(button_callback)


def app():

    return pn.Row(pn.Column( button, pane[0],width=350,height=350, sizing_mode="fixed"), pn.layout.VSpacer(width=10),pane[1])

pn.serve({"localhost:": app}, port=5006)