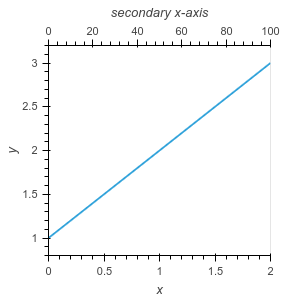
Is there some way to add a secondary x-axis to a plot (using the Bokeh backend)?
I want something like: https://matplotlib.org/stable/gallery/subplots_axes_and_figures/secondary_axis.html
It is possible to get a handle on the Bokeh object after rendering:
curve = hv.Curve([1,2,3])
fig = hv.render(curve)
and then manipulate it like a regular Bokeh plot:
from bokeh.models import LinearAxis, Range1d
from bokeh.plotting import show

fig.extra_x_ranges['sec_x_axis'] = Range1d(0, 100)
ax2 = LinearAxis(x_range_name="sec_x_axis", axis_label="secondary x-axis")
fig.add_layout(ax2, 'above')
show(fig)
2 Likes
Thanks. However, since I have no experience with Bokeh, I am not sure what Range1d is creating.
I should have given an example before, here is one now:
import numpy as np
import matplotlib.pyplot as plt

x = np.linspace(0,2*np.pi,100) # First x axis
y = np.sin(x)+2 # plot on y axis

x2 = np.cumsum(y) # values corresponding to second x axis (it is monotonic)
I want to be able to plot x vs y, and have x2 (which is not linear but monotonic) as the values on the second axis. Not sure how to convert x2 to something like Range1d.
You will have to use a FuncTickFormatter to transform the Linear Range1d axis into your custom x2 axis
(the javascript code mainly do an interp1d between the range 0, 100 and the x2 values)
import numpy as np
import holoviews as hv
from bokeh.models import LinearAxis, Range1d
from bokeh.models import FuncTickFormatter
hv.extension('bokeh')

x = np.linspace(0,2*np.pi,100) # First x axis
y = np.sin(x)+2 # plot on y axis

x2 = np.cumsum(y) # values corresponding to second x axis (it is monotonic)


def hook_secondary_axis(plot, element):
    fig = plot.handles['plot']
    fig.extra_x_ranges['sec_x_axis'] = Range1d(0, 100)
    ax2 = LinearAxis(x_range_name="sec_x_axis", axis_label="secondary x-axis")
    ax2.formatter = FuncTickFormatter(args={"y":x2, "x":np.linspace(0,100,x2.size)}, code="""
      if (tick <= x[0])
        return y[0].toFixed(2)
      if (tick >= x[x.length - 1])
        return y[x.length-1].toFixed(2)
      let indexOfNumberToCompare, leftBorderIndex = 0, rightBorderIndex = x.length - 1
      //Reduce searching range till it find an interval point belongs to using binary search
      while (rightBorderIndex - leftBorderIndex !== 1) {
        indexOfNumberToCompare = leftBorderIndex + Math.floor((rightBorderIndex - leftBorderIndex)/2)
        tick >= x[indexOfNumberToCompare] ? leftBorderIndex = indexOfNumberToCompare : rightBorderIndex = indexOfNumberToCompare
      }
    """)
    fig.add_layout(ax2, 'above')


curve = hv.Curve((x,y)).opts(hooks=[hook_secondary_axis])
curve
1 Like
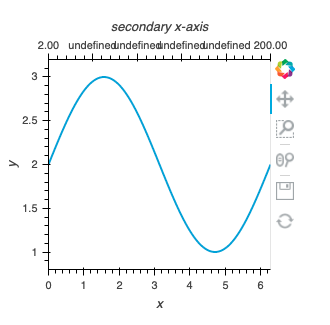
Thanks a lot for the answer. Would be nice if it was possible to do this without using JS.
Also, do I need to install some extra plugins when using this code on jupyterlab?
It seems to be running into some problem on my machine.
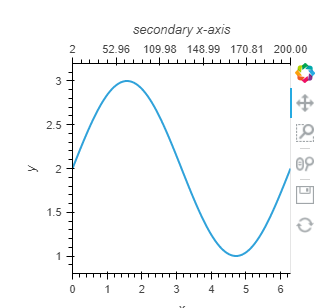
I missed the last statement return y[leftBorderIndex].toFixed(2) in the javascript code:
import numpy as np
import holoviews as hv
from bokeh.models import LinearAxis, Range1d
from bokeh.models import FuncTickFormatter
hv.extension('bokeh')

x = np.linspace(0,2*np.pi,100) # First x axis
y = np.sin(x)+2 # plot on y axis

x2 = np.cumsum(y) # values corresponding to second x axis (it is monotonic)


def hook_secondary_axis(plot, element):
    fig = plot.handles['plot']
    fig.extra_x_ranges['sec_x_axis'] = Range1d(0, 100)
    ax2 = LinearAxis(x_range_name="sec_x_axis", axis_label="secondary x-axis")
    ax2.formatter = FuncTickFormatter(args={"y":x2, "x":np.linspace(0,100,x2.size)}, code="""
      if (tick <= x[0])
        return y[0].toFixed(2)
      if (tick >= x[x.length - 1])
        return y[x.length-1].toFixed(2)
      let indexOfNumberToCompare, leftBorderIndex = 0, rightBorderIndex = x.length - 1
      //Reduce searching range till it find an interval point belongs to using binary search
      while (rightBorderIndex - leftBorderIndex !== 1) {
        indexOfNumberToCompare = leftBorderIndex + Math.floor((rightBorderIndex - leftBorderIndex)/2)
        tick >= x[indexOfNumberToCompare] ? leftBorderIndex = indexOfNumberToCompare : rightBorderIndex = indexOfNumberToCompare
      }
      return y[leftBorderIndex].toFixed(2)
    """)
    fig.add_layout(ax2, 'above')


curve = hv.Curve((x,y)).opts(hooks=[hook_secondary_axis])
curve
3 Likes
Thank you, this works. I have tagged this as a solution now.
Is there a way to get this to work with DynamicMaps so that both plots can be updated?
This post is old and long. Try opening a new post with a minimum, reproducible example. It will make it much easier to understand exactly what you are looking for.
Thanks.
Hi @Marc please find a minimal example illustrating the issue with DynamicMap building on a previous solution at Twin axis · Issue #396 · holoviz/holoviews · GitHub