So, I have a dataframe that looks like this:
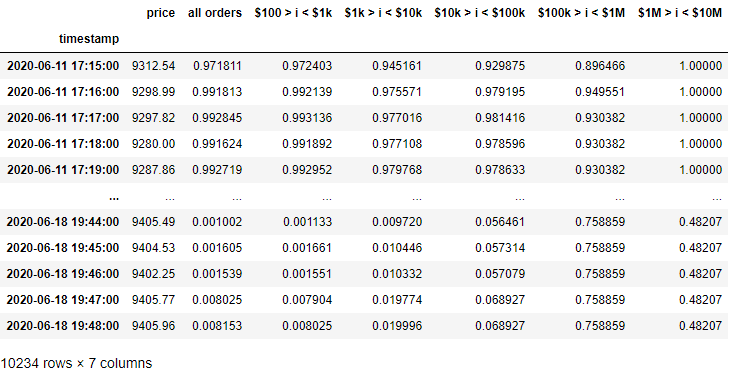
And I would like to plot the first column on the right y-axis, and all other columns on the left y-axis.
I’ve tried to apply the solution found in this issue report:
Using a formatter does apply a secondary y-axis with this function:
def apply_formatter(plot, element):
    p = plot.state

    # create secondary range and axis
    p.extra_y_ranges = {"twiny": Range1d(start=0, end=1)}
    p.add_layout(LinearAxis(y_range_name="twiny"), 'left')

    # set glyph y_range_name to the one we've just created
    glyph = p.select(dict(type=GlyphRenderer))[0]
    glyph.y_range_name = 'twiny'
But it randomly picks one of the columns with index 1 - 6, instead of plotting all and looks like this:
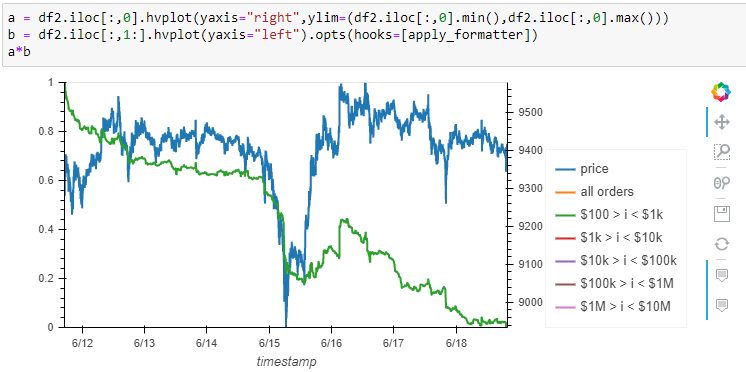
How do I plot them all?
P.S.
You can find the data here:
https://1drv.ms/u/s!ArP7_EkyioIBwqpvJoCmN0_vi9JBYg?e=H5L9Wp