Hi!
I am working with two DataFrames, one storing various power data and on storting temperature data, both with the same DateTime index. From the power DataFrame merged_df and df_OT I would like to create a bokeh plot using hvplot that displays the power and temperature data with two differnent y-axis to be able to better view the variations of the parameter. So far, I have tried differnt solutions with no luck.
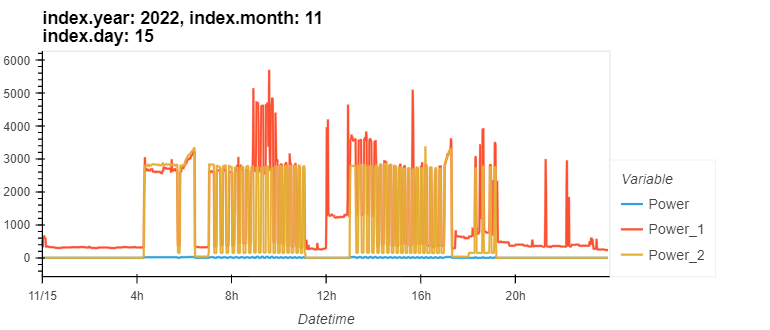
So far I have just managed to get a satifying output for the power alone:
To getthe output with the temperature on the secondary axis I have tried the following:
# Create two line plots for each y-axis
plot1 = merged_df.hvplot.line(groupby=['index.year', 'index.month', 'index.day'], widget_type='scrubber', widget_location='bottom')
plot2 = df_OT.hvplot.line(groupby=['index.year', 'index.month', 'index.day'], widget_type='scrubber', widget_location='bottom')

# Concatenate the plots vertically
combined_plot = plot1 * plot2

# Set the y-axis options manually
overlay_plot.opts(yaxis='left', yaxis2='right')

# Display the plot
combined_plot
giving an error as follows:
---------------------------------------------------------------------------
TypeError                                 Traceback (most recent call last)
Cell In[17], line 6
      3 plot2 = df_OT.hvplot.line(groupby=['index.year', 'index.month', 'index.day'], widget_type='scrubber', widget_location='bottom')
      5 # Concatenate the plots vertically
----> 6 combined_plot = plot1 * plot2
      8 # Set the y-axis options manually
      9 overlay_plot.opts(yaxis='left', yaxis2='right')

TypeError: unsupported operand type(s) for *: 'Column' and 'Column'
when trying the alternative following option I get a similar error:
plot1 = merged_df.hvplot(groupby=['index.year','index.month','index.day'], widget_type='scrubber', widget_location='bottom').opts(yaxis='left')
plot2 = df_OT.hvplot(groupby=['index.year','index.month','index.day'], widget_type='scrubber', widget_location='bottom').opts(yaxis='right')

# Overlay the two line plots
overlay_plot = plot1 * plot2

# Display the plot
overlay_plot
error
AttributeError: ‘Column’ object has no attribute ‘opts’
Do you see any solution that would help fix that issue?