cwerner
1
Hi.
Big fan of hvplot here 
I’m currently struggling to create a map view with a slider for time and a select/ dropdown to specify the variable the user wants to display…
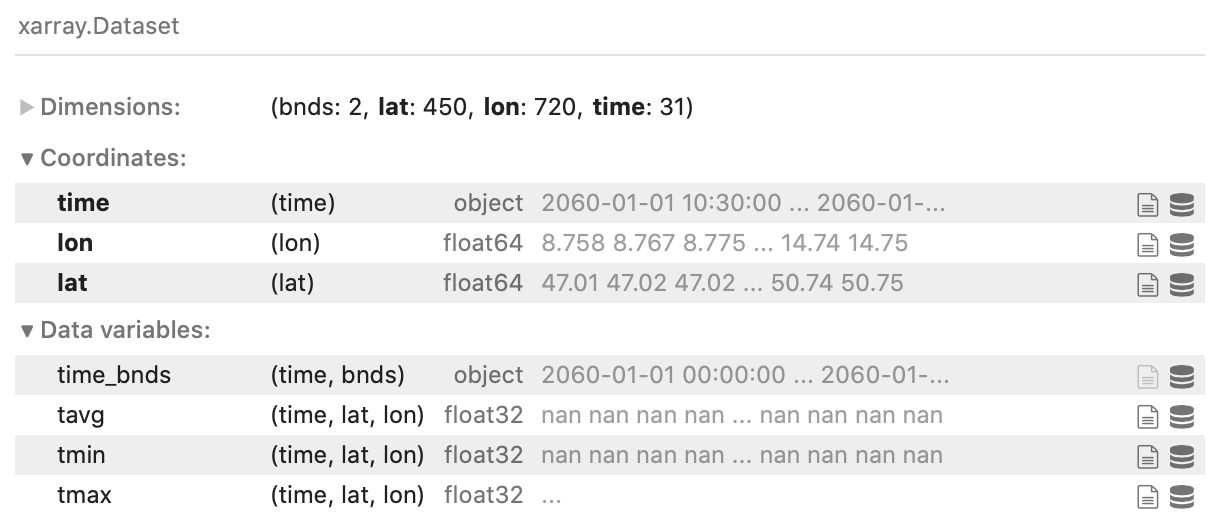
This is the xarray dataset layout:
Not sure if this is currently possible?
If I plot on a select variable (tavg in this case) I get a map with a slider for time (as expected).
temp.tavg.hvplot(geo=True, groupby='time')
However, I also want to have a select box for the 3 data variables (tmin, tmax, tavg) contained in the xarray dataset “temp”…
How would I specify this?
Cheers
You could do something like this using Panel:
import panel as pn
import xarray as xr
import hvplot.xarray

ds = xr.tutorial.open_dataset('air_temperature')
ds = xr.Dataset({'air': da['air'], 'air2': ds['air']})
sel = pn.widgets.Select(options=list(ds.data_vars), name='Data Variable')

pn.Column(sel, ds.hvplot.image(z=sel, groupby='time'))
3 Likes
cwerner
3
Thanks, that does the trick for me.