Select/deselect behavior for hv.Labels

I’m having trouble understanding the logic (feature? bug?) behind tap-selection behavior of a simple points plot with labels.
Take the (slightly modified) example from the hvplot user reference:

import hvplot.pandas  # noqa

import pandas as pd

df = pd.DataFrame(
    {'City': ['Buenos Aires', 'Brasilia', 'Santiago', 'Bogota', 'Caracas'],
     'Country': ['Argentina', 'Brazil', 'Chile', 'Colombia', 'Venezuela'],
     'Latitude': [-34.58, -15.78, -33.45, 4.60, 10.48],
     'Longitude': [-58.66, -47.91, -70.66, -74.08, -66.86]})


points = df.hvplot.points(x='Longitude', y='Latitude', padding=0.2, hover_cols='all', width=300)
labels = df.hvplot.labels(x='Longitude', y='Latitude', text='City', text_baseline='bottom', hover=False) 
overlay = (points * labels)

points.opts(tools=['tap'])
overlay.opts(
    opts.Labels(text_font_size='8pt', xoffset=0.08),
    opts.Points(color='black', size=5, active_tools=['tap'],)
)

rec
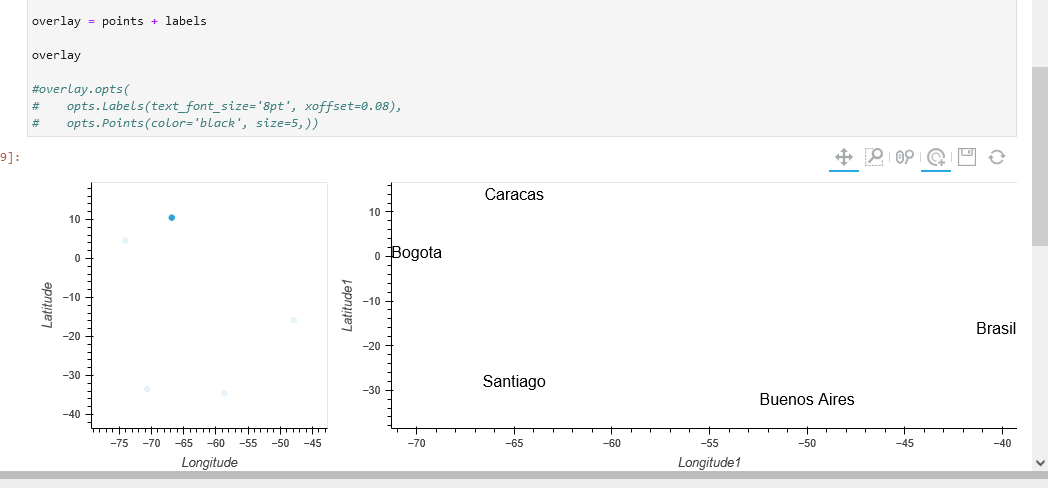
By tapping, I can apparently select the label or the marker, but it seems that they do not result in the same selection. Or am I missing something?

More importantly, can I disable selection for the labels?

For hv.Points, I understand I can do something like points.opts(nonselection_alpha = 1), and have the nonselected points appear unchanged upon selection, but running labels.opts(nonselection_alpha = 1) throws me a ValueError: Unexpected option 'nonselection_alpha' for Labels type across all extensions. No similar options found.

Hi @szarma,

I don’t know for sure, I think tap here in this case, is a tool that applies across the graph (and conjointly when the graphs are joined with *) rather than specfic dataframe. I think the tap is selecting ‘nearest’ as some of the points and labels overlap they get selected together and not individually; what I done was seperate out the dataframes then I changed the location of the markers so there was some ‘air’ between the points and the labels. Now when I tap either points or labels the remaining stay fixed… So that’s the functionality here I think.

I’m not aware of a way to prevent the tap from working on the other but maybe there is just not come across it, perhaps tap stream would work here in that you might be able to tap and return an appropriate dataset to that tap…

import hvplot.pandas  # noqa#
import holoviews as hv
from holoviews import dim, opts

import pandas as pd

df_points = pd.DataFrame(
    {'City': ['Buenos Aires', 'Brasilia', 'Santiago', 'Bogota', 'Caracas'],
     'Country': ['Argentina', 'Brazil', 'Chile', 'Colombia', 'Venezuela'],
     'Latitude': [-34.58, -15.78, -33.45, 4.60, 10.48],
     'Longitude': [-58.66, -47.91, -70.66, -74.08, -66.86]})

df_labels = pd.DataFrame(
    {'City1': ['Buenos Aires', 'Brasilia', 'Santiago', 'Bogota', 'Caracas'],
     'Country1': ['Argentina', 'Brazil', 'Chile', 'Colombia', 'Venezuela'],
     'Latitude1': [-34.00, -18.00, -30.00, -1.00, 12.00],
     'Longitude1': [-50.00, -40.00, -65.00, -70.00, -65.00]})


points = df_points.hvplot.points(x='Longitude', y='Latitude', padding=0.2, hover_cols='all', width=300)
labels = df_labels.hvplot.labels(x='Longitude1', y='Latitude1', text='City1', text_baseline='bottom', hover=False) 

points.opts(tools=['tap'])

overlay = points * labels

overlay

#overlay.opts(
#    opts.Labels(text_font_size='8pt', xoffset=0.08),
#    opts.Points(color='black', size=5,))

If I change the * operator to + I get this and the tap only affects the graph the tap is applied too so maybe it is a feature request for the * operator but I have zero idea how tricky it may be to implement if there is not already a way to do it

1 Like

Yeah, thanks for taking a stab at this, @carl. Essentially, I wish to show the labels, but disable any interaction with them.

I understand I can use points as the only source for the stream (hv.streams.Selection1D(source=points)), and my core functionality is not suffering, but it is confusing that the user has the appearance of (de)selecting labels…