This might have been answered before, but I can’t seem to find a good post/tutorial/documentation.
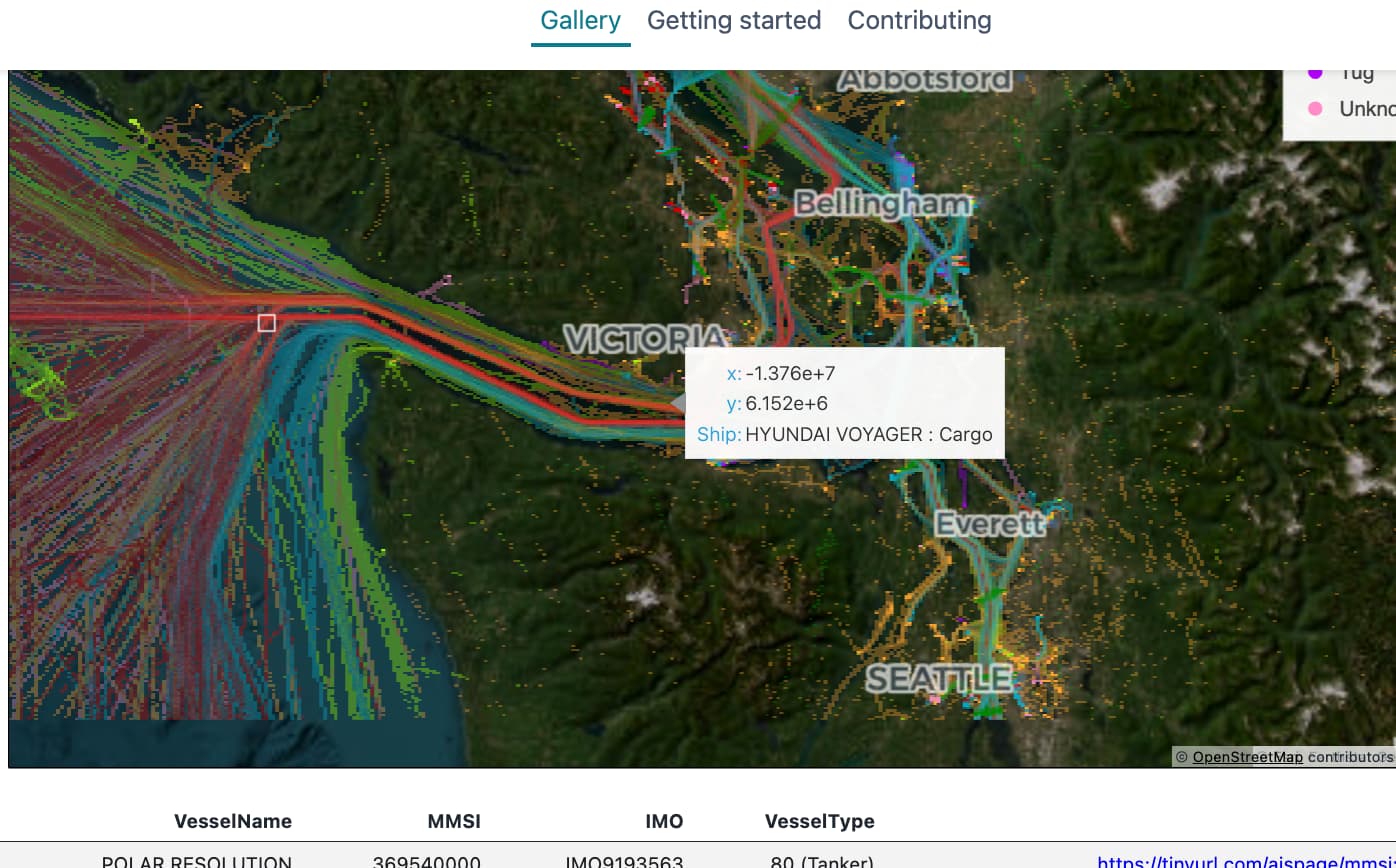
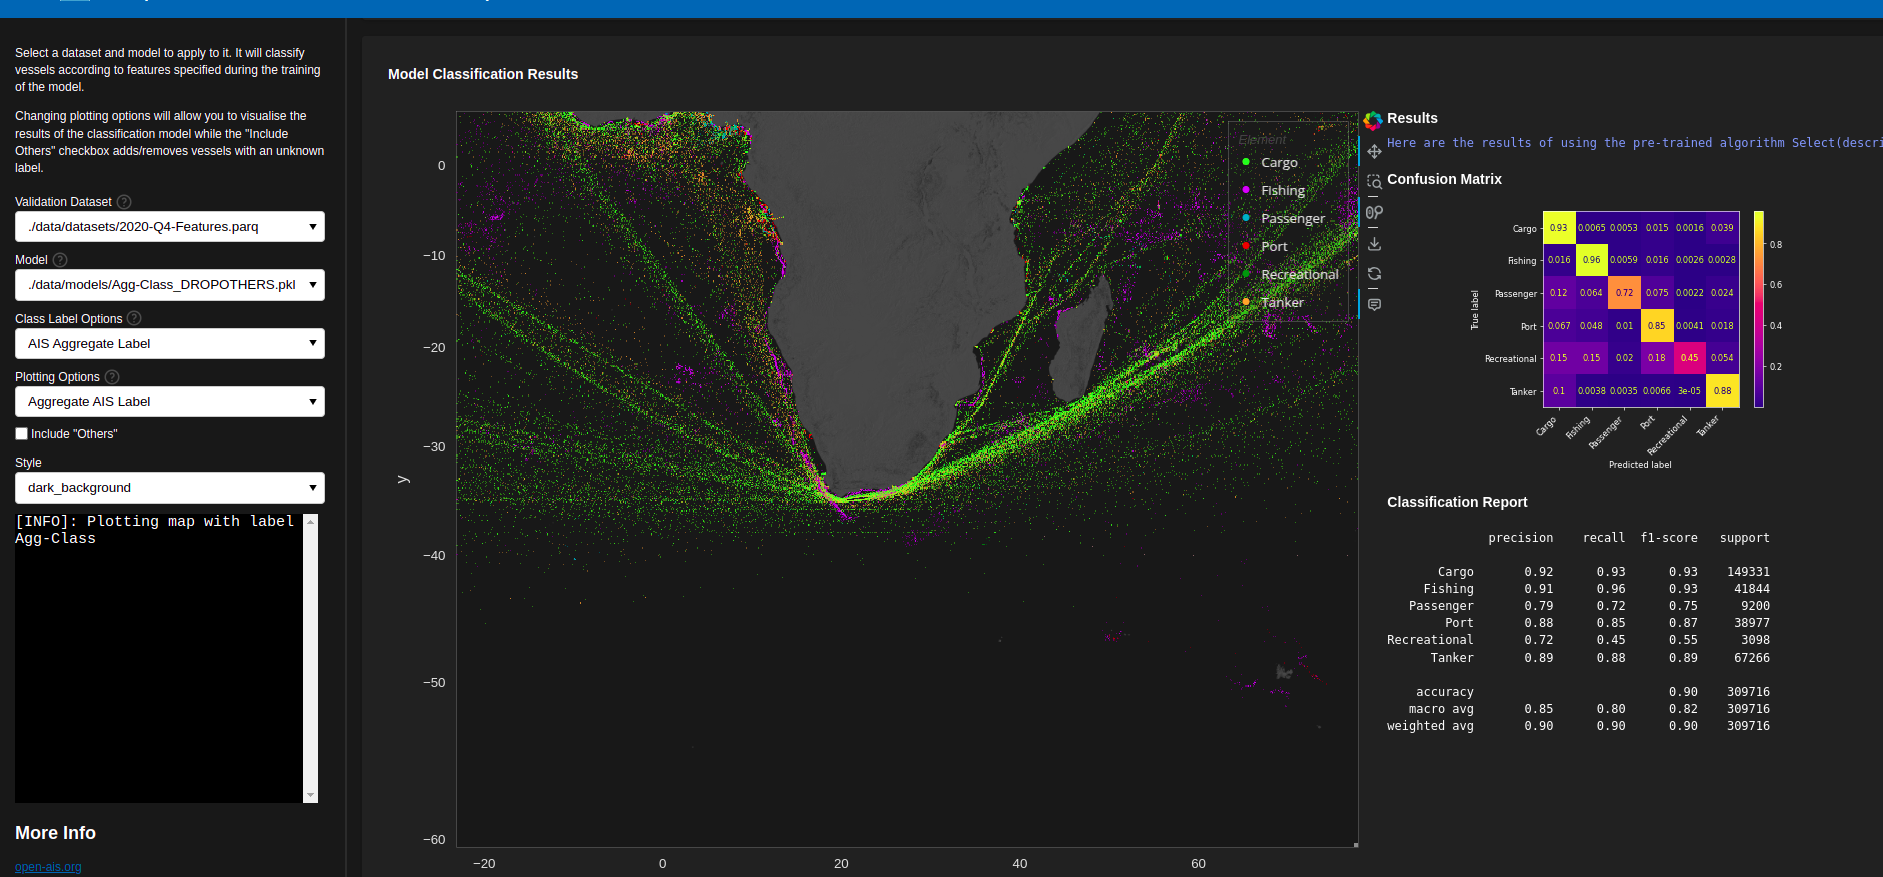
I have a large dataset of ship positions that I’m running through an classification algorithm to predict the vessel class. I’m working on a Panel-app to quickly swap out datasets, pre-trained models, classification labels etc. I then plot algorithm performance and would also like to plot things like SHAP decision making for specific samples. Here’s a screen shot of a work-in-progress:
It seems that I can’t select individual data points using datashader (makes sense, I’m looking at an aggregate displayed on the map). But it would be useful to be able to get information on all data points that fall within the current window, or that are selected by a box draw tool.
I’d like to be able to zoom into a region, update the Confusion Matrix and Classification Report to see how the algorithm performance changes for different regions.
Any ideas on the correct way to do this or a nice example that does something similar?