I believe what I have mashed up between your code and Marc’s ‘How do I link Plots and Tables?’, will show you a way to your objective.
Also I’m new to Python, and running this in Jupyter notebook, I’m unaware on how to access table in print_indexes without using global. So, I would think there would be a more elegant way to access table. I hope this helps!
import pandas as pd
import numpy as np
import holoviews as hv
from holoviews import opts
import panel as pn
import param
from holoviews.selection import link_selections
hv.extension('bokeh')
df = pd.DataFrame(np.random.rand(100,3), columns=['a','b','c'])
dataset = hv.Dataset(df)
link = link_selections.instance()
table = None
def print_sel_indices():
for i in table.dframe().index:
print("Dataset index '{i}' is currently selected:".format(i=i))
print(dataset.iloc[i].data)
print("-----------------------------------------")
@param.depends(link.param.selection_expr)
def sel_indices_to_table(_):
global table
table = hv.Table(dataset.select(link.selection_expr)).opts(width=900, height=200)
return table
scatter1 = hv.Scatter(data=dataset, kdims=['a', 'b'], vdims=['b'])
scatter2 = hv.Scatter(data=dataset, kdims=['a', 'c'], vdims=['c'])
scat_plots = link(scatter1 + scatter2).cols(2)
scat_plots.opts(shared_axes=True, shared_datasource=False)
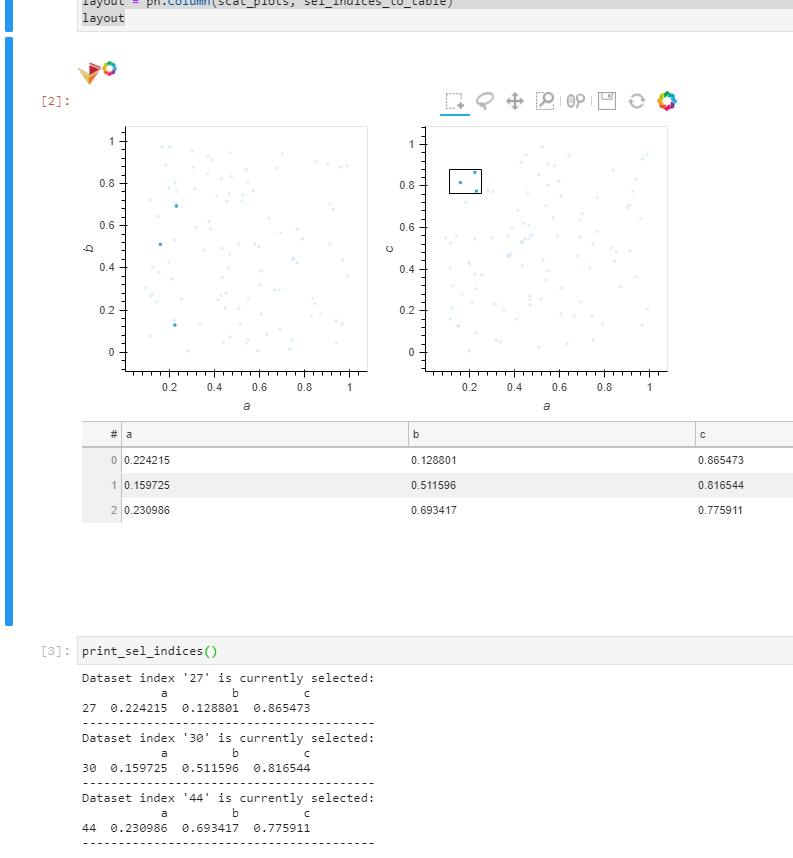
layout = pn.Column(scat_plots, sel_indices_to_table)
layout
And by calling print_sel_indices, as seen in image, prints what is currently selected.