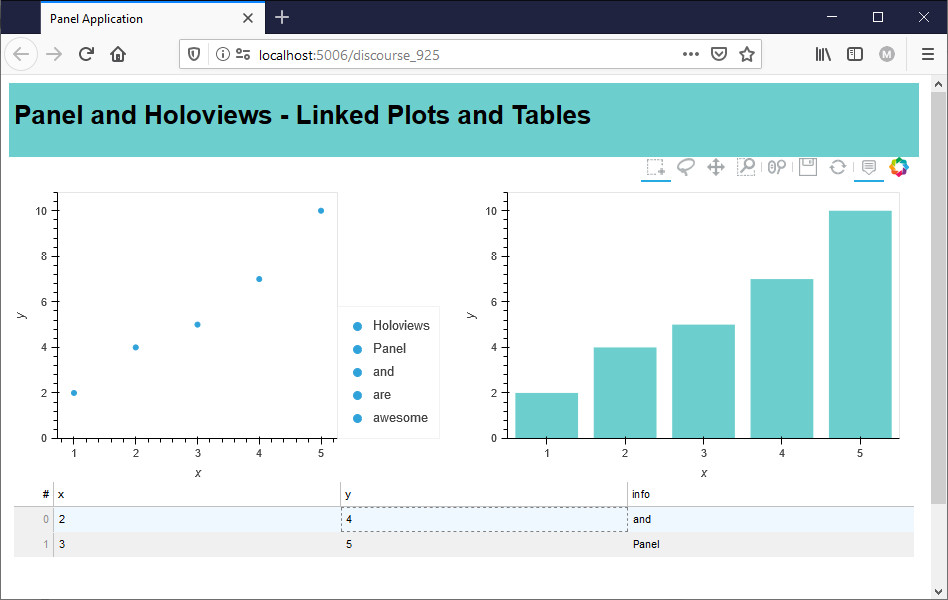
How do I link Plots and Tables
A lot of times when I create a Dashboard my users would like to be able to zoom or select in one or more plots and also see the details of the selected data in a table.
There is also a feature request like this on Github https://github.com/holoviz/holoviews/issues/4505
So how do I create this?
My attempt is below based on a combination of Holoviews Linked Brushing and Panel. Do you have a better suggestion?
import pandas as pd
import holoviews as hv
from holoviews.selection import link_selections
import panel as pn
import param
hv.extension('bokeh')

COLOR = "#6dcfcd"

data = {"x": [1,2,3,4,5], "y": [2,4,5,7,10], "info": ["Holoviews", "and", "Panel", "are", "awesome"]}
df = pd.DataFrame(data)
dataset = hv.Dataset(df)

scatter = hv.Scatter(dataset, "x", "y").opts(color=COLOR, width=450, size=25, default_tools=[], tools=['box_select'])

bars = hv.Bars(dataset, "x", "y").opts(color=COLOR, width=450, alpha=0.5, line_width=0, default_tools=[], tools=['box_select'],)

link = link_selections.instance()
plots = link(scatter+bars)

bar = pn.Row(pn.pane.Markdown("# Panel and Holoviews - Linked Plots and Tables", sizing_mode="stretch_width"), sizing_mode="stretch_width", background=COLOR)

@param.depends(link.param.selection_expr)
def selection_table(_):
    return hv.Table(dataset.select(link.selection_expr)).opts(width=900, height=200)

app = pn.Column(bar, plots, selection_table, height=600)
app