Following the interactive time series example from @ahuang11, I have this code:
import panel as pn
import xarray as xr
import holoviews as hv
import hvplot.xarray

pn.extension()
ds = xr.tutorial.open_dataset('air_temperature')
ds = ds.assign_coords(lon=(((ds.lon + 180) % 360) - 180), lat=ds.lat*1.0)
image, select = ds.hvplot('lon', 'lat', geo=True, cmap='viridis', widgets={'time':pn.widgets.Select})
stream = hv.streams.Tap(source=image.object, x=-88, y=40)

def timeseries(x, y):
    return ds.sel(lon=x, lat=y, method='nearest').hvplot('time', grid=True)

timeseries_plot = pn.bind(timeseries, x=stream.param.x, y=stream.param.y)
pn.Column(pn.Row(select), pn.Row(image, timeseries_plot))
which produces:
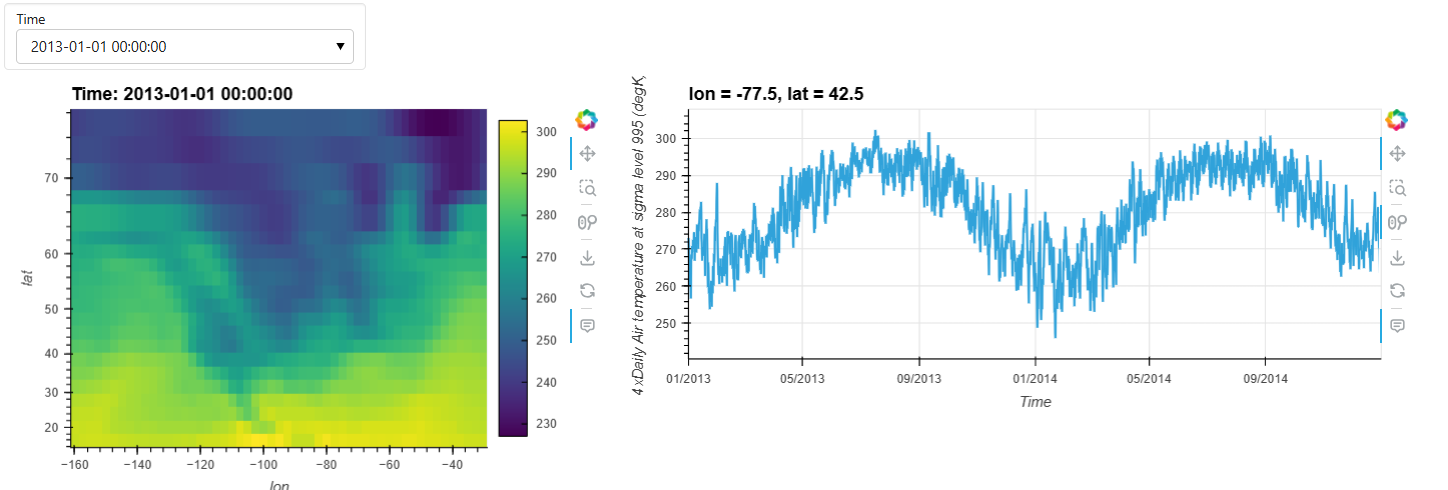
I thought I would enhance this by putting a marker on the map indicating where the user clicked to extract the time series.
I was able to create a points object with hvplot:
import pandas as pd
import hvplot.pandas
df = pd.DataFrame({'lon':[-88.0], 'lat':[40], 'station':[0]})
station_plot = df.hvplot.points(x='lon', y='lat', geo=True, by='station', size=15)
which displays fine on it’s own, but when I try to overlay it on the image object above:
image * station_plot
I get back:
image * station_plot
---------------------------------------------------------------------------
TypeError                                 Traceback (most recent call last)
Cell In[5], line 1
----> 1 image * station_plot

File /home/conda/global/b214724c3d4b6220c3e488e703fac35666e3afcee1879723c6ab99b60541a259-20240520-181650-902933-130-pangeo/lib/python3.11/site-packages/holoviews/core/ndmapping.py:1023, in UniformNdMapping.__rmul__(self, other)
   1022 def __rmul__(self, other):
-> 1023     return self.__mul__(other, reverse=True)

TypeError: Overlayable.__mul__() got an unexpected keyword argument 'reverse'
And when I tried to figure out what was wrong by simply plotting the image object, I see that it still has the widget attached:
image
produces:
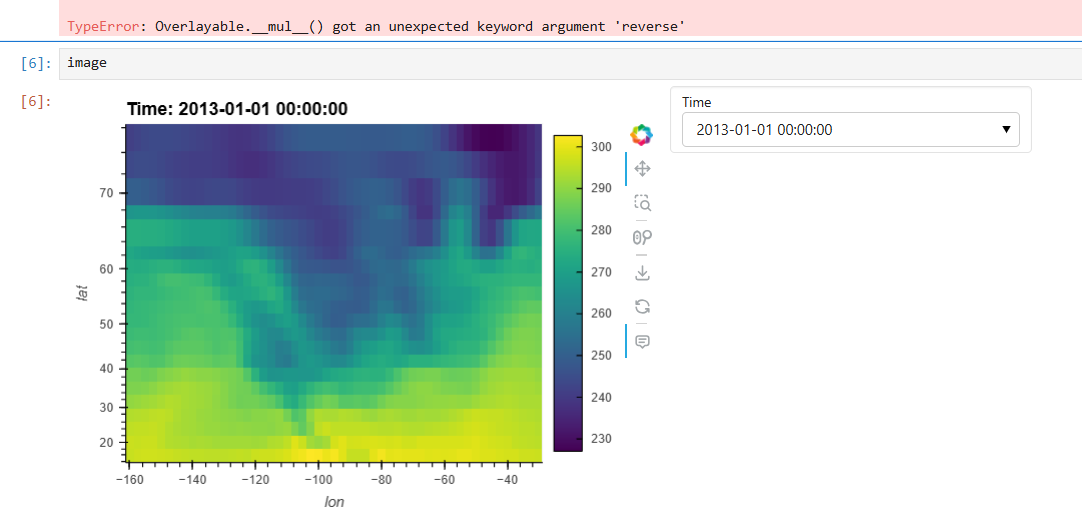
If this is the problem, how do I remote the widget from this object?
Or if not, how can I overlay my points object on the map?
In case it’s useful, the whole rendered notebook is here: Jupyter Notebook Viewer (nbviewer.org)


