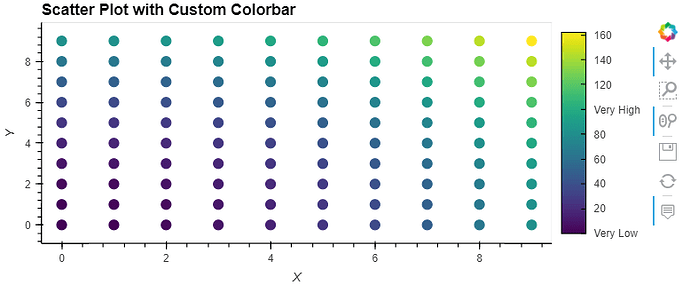
I want to set the ticks and ticklabels for the colorbar using hvplot.
I couldn’t find an example on the docs.
import numpy as np
import pandas as pd

# Create data for a 2D grid
x = np.arange(10)
y = np.arange(10)
X, Y = np.meshgrid(x, y)

# Some function to evaluate on the grid
Z = X**2 + Y**2

# Create a Pandas DataFrame for easy plotting
ds = pd.DataFrame({'X': X.ravel(), 'Y': Y.ravel(), 'Z': Z.ravel()}).to_xarray().drop("index") # because I am working with xarray

# Create the hvplot
plot = ds.hvplot.scatter(x='X', y='Y', c='Z', cmap='viridis', s=100,  title='Scatter Plot with Custom Colorbar')

# Define custom ticks and labels
ticks = [0, 25, 50, 75, 100]
labels = ['Very Low', 'Low', 'Medium', 'High', 'Very High']

# Apply colorbar customization
plot.opts(
    colorbar=True,
    colorbar_opts={
        'major_label_overrides': dict(zip(ticks, labels))
    }
)


# Display the plot
plot
I also tried what is described in #382
import xarray as xr
import hvplot.xarray
zz = xr.tutorial.open_dataset('air_temperature')
zz.hvplot('lon', 'lat').opts(colorbar_opts={'ticker': {273: 'freezing', 280: 'above'}})
but it returns
ValueError [Call holoviews.ipython.show_traceback() for details]
failed to validate ColorBar(id='5139', ...).ticker: expected an element of either Instance(Ticker) or Auto, got {273: 'freezing', 280: 'above'}
Selection deleted
Any easy way to make it work?
