I’m trying to plot a single lon,lat point (a station location) using hvplot to see where the point is located, so naturally I’d like to have a tile service on (e.g. tiles=ESRI).
If I just plot the point with the tile service on, the default plot limits are too small and I can’t see where the point is.
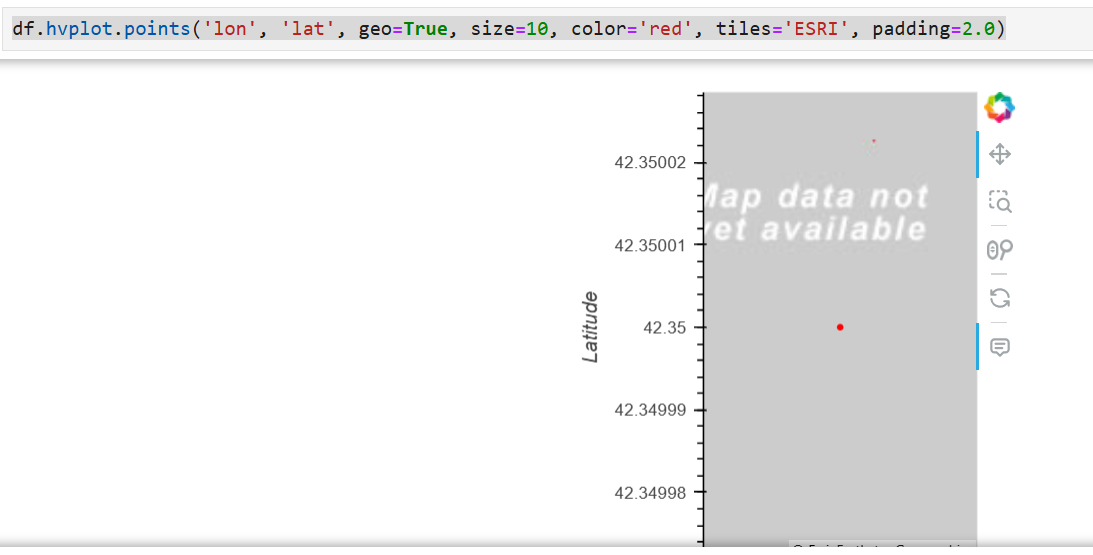
If I set the padding to several degrees, it seems to work without tiles, but not with tiles:
import hvplot.pandas
import pandas as pd

# Create a DataFrame with the single lon, lat point
data = {'lon': [-70.4], 'lat': [42.35]}  # A point in Massachusetts Bay
df = pd.DataFrame(data)
df.hvplot.points('lon', 'lat', geo=True, size=10, color='red', tiles='ESRI', padding=2.0)
How to overcome this?
Maybe set max_zoom= of the tiles. Working with Bokeh — GeoViews v1.14.0 (I think you may have to separate the tiles call, e.g. overlay it rather than call kwarg.
I think I didn’t explain myself clearly – my problem is not that I don’t have tile map data at that zoom level.
My problem is that I don’t want the plot to be that zoomed in.
So I’m trying to increase the padding so that the “default” xlims and ylims cover an area of 2x2 degrees ( zoomed out!)
Seems like an issue; maybe you can submit an hvplot issue. Otherwise you can manually calculate the xlim
import hvplot.pandas
import pandas as pd
import geoviews as gv
import cartopy.crs as ccrs

# Create a DataFrame with the single lon, lat point
data = {"lon": [-70.4], "lat": [42.35]}  # A point in Massachusetts Bay
df = pd.DataFrame(data)
df.hvplot.points(
    "lon", "lat", geo=True, projection=ccrs.GOOGLE_MERCATOR, size=10, color="red", padding=(5, 1)
) * gv.tile_sources.CartoLight.opts(max_zoom=12)
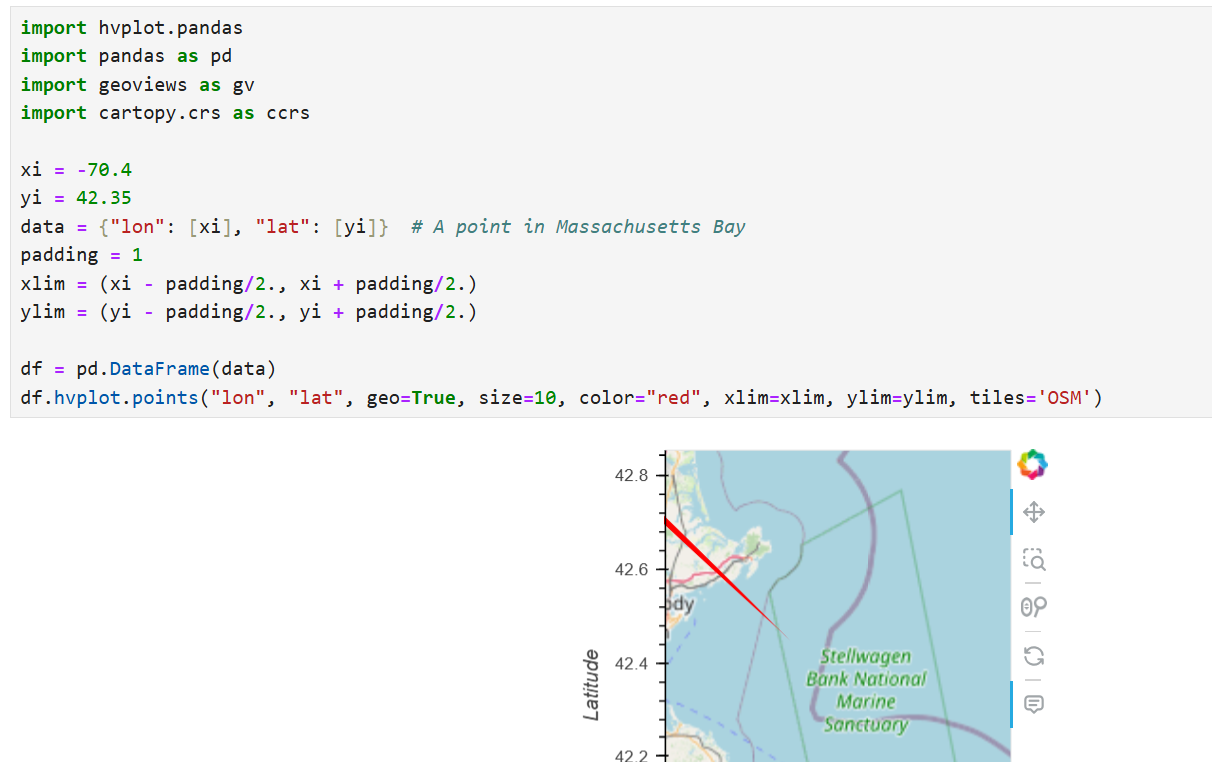
Okay, this is strange. If I explicitly set the limits, the dot is not longer a dot?
import hvplot.pandas
import pandas as pd
import geoviews as gv
import cartopy.crs as ccrs

xi = -70.4
yi = 42.35
data = {"lon": [xi], "lat": [yi]}  # A point in Massachusetts Bay
padding = 1
xlim = (xi - padding/2., xi + padding/2.)
ylim = (yi - padding/2., yi + padding/2.)

df = pd.DataFrame(data)
df.hvplot.points("lon", "lat", geo=True, size=10, color="red", xlim=xlim, ylim=ylim, tiles='OSM')
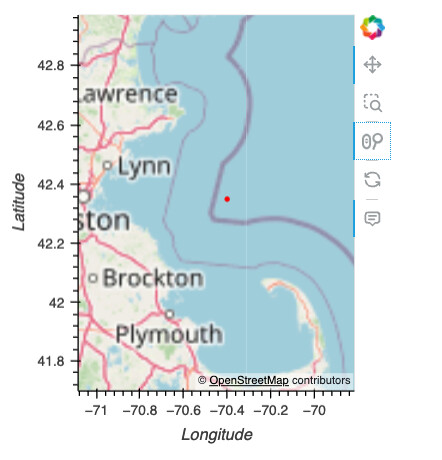
Weird; I can’t seem to reproduce
(pangeo) rsignell@OSC:~$ conda list "hvplot|geoviews"
# packages in environment at /home/rsignell/miniforge3/envs/pangeo:
#
# Name                    Version                   Build  Channel
geoviews                  1.14.0               hd8ed1ab_0    conda-forge
geoviews-core             1.14.0             pyha770c72_0    conda-forge
hvplot                    0.11.2             pyhd8ed1ab_0    conda-forge
OMG. The good old sequence from Blank output with latest holoviz from conda-forge - #11 by philippjfr did the trick 
- Clear the notebook
- Save the notebook
- Reload the page
- Rerun the notebook
In JupyterLab you additionally have to make sure that none of the other tabs are loading an older version of Bokeh which might interfere.
1 Like