I’d really like to plot some data using a geostationary projection with Esri earth imagery.
I can do that just fine with the default GOOGLE_MERCATOR projection used by geoviews.
import geoviews as gv
from geoviews import opts
import cartopy.crs as ccrs
gv.extension('bokeh')

tiles = gv.tile_sources.EsriImagery()

data = [[ -86.21487 ,   37.04926 ],[ -83.344385,   33.918137],[ -75.6106  ,   38.6539  ],[-122.633579,   41.726892],[-122.480487,   43.744352],[ -82.53532 ,   37.4826  ],[-100.76821 ,   46.825425],[-119.8284  ,   34.44551 ],[ -71.423705,   41.49511 ],[-109.455315,   47.048537],[ -98.391403,   29.529432],[ -90.160477,   38.612034],[ -77.54817 ,   43.14618 ],[ -84.36625 ,   39.2787  ],[ -80.420833,   40.445278],[ -95.38769 ,   29.81453 ],[-112.00264 ,   33.41046 ],[ -80.243995,   40.268963],[ -80.80116 ,   41.23172 ],[ -79.863572,   40.43743 ]]

tiles * gv.Points(data).opts(color='red', width=400)
That gives a plot with the points in the correct location. I can’t post the plot because I’m a new user and can only put one plot. You’ll have to plot that yourself.
Now, if I try changing the projection of the tile source, I get this thing.
geo = ccrs.Geostationary(central_longitude=-100)
geostationary = gv.tile_sources.EsriImagery(projection=geo)

geostationary * gv.Points(data).opts(color='red', width=400, projection=geo)
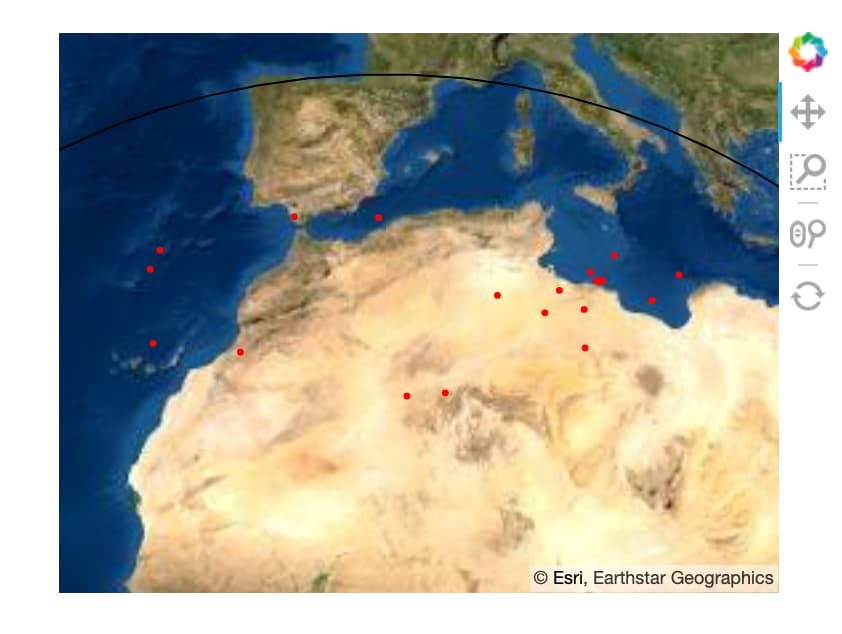
What am I doing wrong?