Trying to set xticks on a bar chart, but the ticks that show up seem to be sequential index numbers rather than the values of the appropriate variable.
For example, adapting from an example found in the docs:
import holoviews as hv
from hvplot.sample_data import us_crime
hv.extension('bokeh','matplotlib')
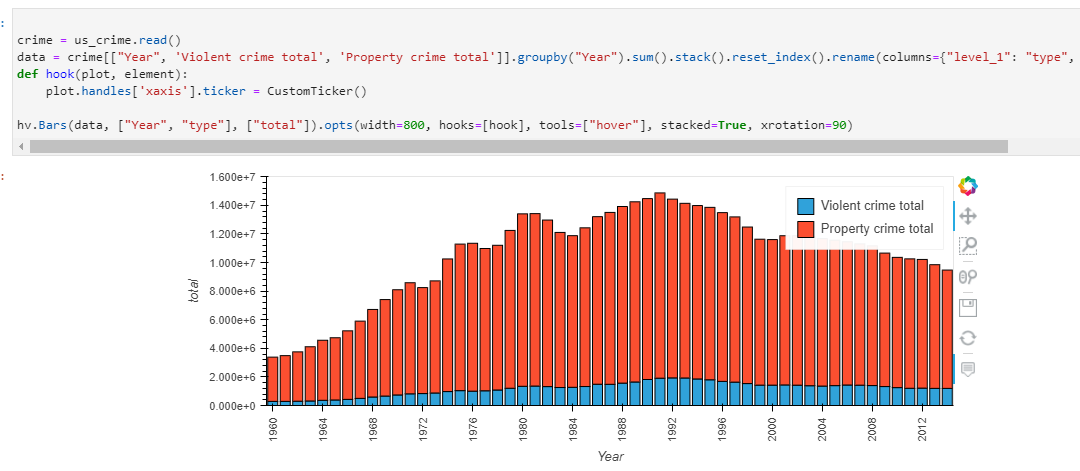
crime = us_crime.read()
data = crime[["Year", 'Violent crime total', 'Property crime total']].groupby("Year").sum().stack().reset_index().rename(columns={"level_1": "type", 0: "total"}).set_index("Year")
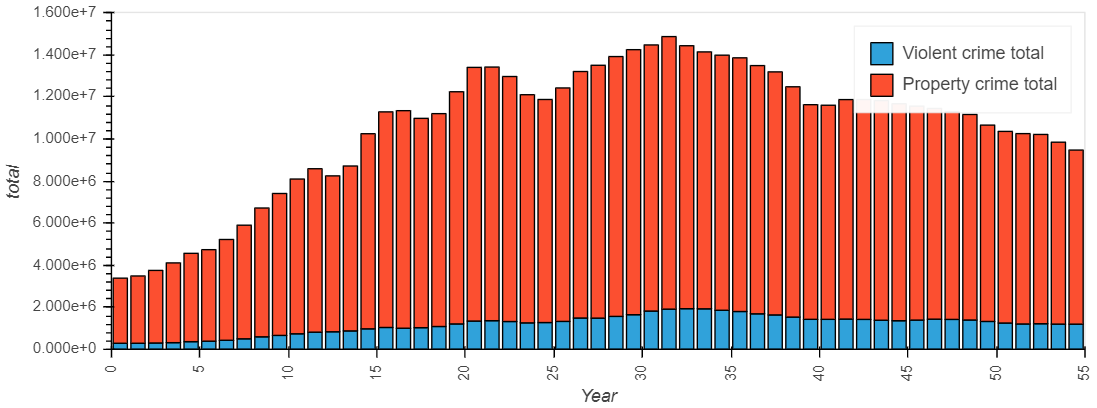
hv.Bars(data, ["Year", "type"], ["total"]).opts(width=800, tools=["hover"], stacked=True, xrotation=90, toolbar=None, xticks=10)
The above code produces:
Another attempt:
hv.Bars(data, ["Year", "type"], ["total"]).opts(width=800, tools=["hover"], stacked=True, xrotation=90, toolbar=None, xticks=[(0, 1960), (55, 2014)])
Output:

Is this the correct approach? Is this a bug?
I would appreciate any input, insight, or guidance.
EDIT:
Here is another thing I tried that resulted in a blank xaxis:
from bokeh.io import show
from bokeh.models import FixedTicker

plot = hv.Bars(data, ["Year", "type"], ["total"]).opts(width=800, tools=["hover"], stacked=True, xrotation=90, toolbar=None)
bokeh_plot = hv.render(plot)
ticks = data.index.unique()[::4].tolist()
ticker = FixedTicker(ticks=ticks)
bokeh_plot.xaxis.ticker = ticker
show(bokeh_plot)