What I am trying to do is to create a dashboard that users can select the property that they want to display. Thus,
import hvplot.xarray
import xarray as xr

ds = xr.tutorial.open_dataset('air_temperature').load().sel(time='2013-06-01 12:00')
# create a new variable. In this case, the temperature anomaly
ds = ds.assign(air_anomaly = ds.air - ds.air.mean())

# create the interactive dataset
dsi = ds.interactive(loc = "left")

# the property options
property_list = ["air", "air_anomaly"]
property = pn.widgets.Select(options = property_list, width = 150)
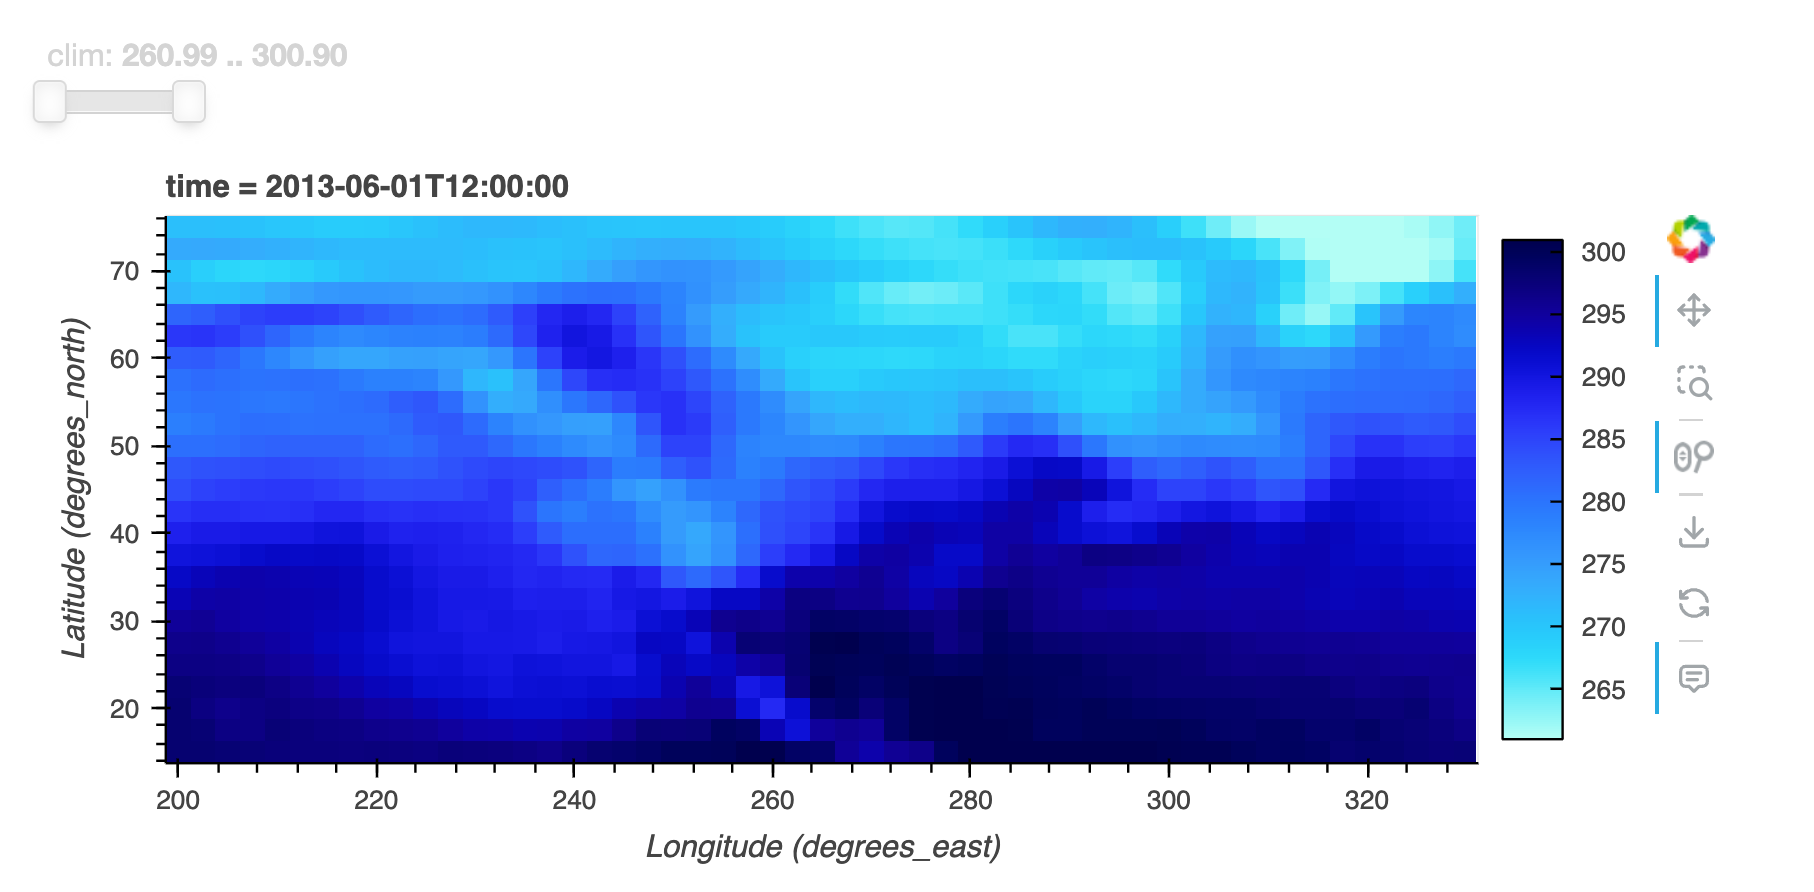
This example works, but you have to manually set the vmin and vmax everytime you change the variable.
vmin = pn.widgets.FloatInput(name = 'vmin', width = 60)
vmax = pn.widgets.FloatInput(name = 'vmax', width = 60)

dsi[property].plot(clim = (vmin, vmax))
This example would be better, because users can still set the vmin and vmax, but their default values depend on the variable that is being plotted.
vmin = pn.widgets.FloatInput(name = 'vmin', width = 60, value = dsi[property].quantile(0.01).values.tolist())
vmax = pn.widgets.FloatInput(name = 'vmax', width = 60, value = dsi[property].quantile(0.99).values.tolist())

dsi[property].plot(clim = (vmin, vmax))
But this code returns an error:
---------------------------------------------------------------------------
AttributeError                            Traceback (most recent call last)
Cell In[55], line 5
      2 vmin = pn.widgets.FloatInput(name = 'vmin', width = 60, value = dsi[property].quantile(0.01).values.tolist())
      3 vmax = pn.widgets.FloatInput(name = 'vmax', width = 60, value = dsi[property].quantile(0.99).values.tolist())
----> 5 dsi[property].plot(clim = (vmin, vmax))

File ~/miniforge3/envs/coringa/lib/python3.9/site-packages/hvplot/interactive.py:517, in Interactive.__call__(self, *args, **kwargs)
    515     method = type(new._transform)(new._transform, new._method, accessor=True)
    516     kwargs = dict(new._inherit_kwargs, **kwargs)
--> 517     clone = new._clone(method(*args, **kwargs), plot=new._method == 'plot')
    518 finally:
    519     # If an error occurs reset _method anyway so that, e.g. the next
    520     # attempt in a Notebook, is set appropriately.
    521     new._method = None

File ~/miniforge3/envs/coringa/lib/python3.9/site-packages/hvplot/interactive.py:388, in Interactive._clone(self, transform, plot, loc, center, dmap, copy, max_rows, **kwargs)
    386 else:
    387     kwargs = dict(self._inherit_kwargs, **dict(self._kwargs, **kwargs))
--> 388 return type(self)(self._obj, fn=self._fn, transform=transform, plot=plot, depth=depth,
    389                  loc=loc, center=center, dmap=dmap, _shared_obj=self._shared_obj,
    390                  max_rows=max_rows, **kwargs)

File ~/miniforge3/envs/coringa/lib/python3.9/site-packages/hvplot/interactive.py:282, in Interactive.__init__(self, obj, transform, fn, plot, depth, loc, center, dmap, inherit_kwargs, max_rows, method, _shared_obj, _current, **kwargs)
    280     self._current_ = _current
    281 else:
--> 282     self._current_ = self._transform.apply(ds, keep_index=True, compute=False)
    283 self._init = True
    284 self._dirty = False

File ~/miniforge3/envs/coringa/lib/python3.9/site-packages/holoviews/util/transform.py:767, in dim.apply(self, dataset, flat, expanded, ranges, all_values, keep_index, compute, strict)
    762     data = dataset.interface.values(
    763         dataset, lookup, expanded=expanded, flat=flat,
    764         compute=compute_for_compute, keep_index=keep_index_for_compute
    765     )
    766 for op in self.ops:
--> 767     fn, fn_name, args, kwargs, accessor = self._resolve_op(
    768         op, dataset, data, flat, expanded, ranges, all_values,
    769         keep_index_for_compute, compute_for_compute, strict
    770     )
    771     drange = ranges.get(eldim, {})
    772     drange = drange.get('combined', drange)

File ~/miniforge3/envs/coringa/lib/python3.9/site-packages/holoviews/util/transform.py:643, in dim._resolve_op(self, op, dataset, data, flat, expanded, ranges, all_values, keep_index, compute, strict)
    638     if isinstance(v, dim):
    639         v = v.apply(
    640             dataset, flat, expanded, ranges, all_values,
    641             keep_index, compute, strict
    642         )
--> 643     fn_kwargs[k] = resolve_dependent_value(v)
    644 args = tuple(fn_args[::-1] if op['reverse'] else fn_args)
    645 kwargs = dict(fn_kwargs)

File ~/miniforge3/envs/coringa/lib/python3.9/site-packages/holoviews/core/util.py:1616, in resolve_dependent_value(value)
   1614     value = [resolve_dependent_value(v) for v in value]
   1615 elif isinstance(value, tuple):
-> 1616     value = tuple(resolve_dependent_value(v) for v in value)
   1617 elif isinstance(value, dict):
   1618     value = {
   1619         resolve_dependent_value(k): resolve_dependent_value(v) for k, v in value.items()
   1620     }

File ~/miniforge3/envs/coringa/lib/python3.9/site-packages/holoviews/core/util.py:1616, in <genexpr>(.0)
   1614     value = [resolve_dependent_value(v) for v in value]
   1615 elif isinstance(value, tuple):
-> 1616     value = tuple(resolve_dependent_value(v) for v in value)
   1617 elif isinstance(value, dict):
   1618     value = {
   1619         resolve_dependent_value(k): resolve_dependent_value(v) for k, v in value.items()
   1620     }

File ~/miniforge3/envs/coringa/lib/python3.9/site-packages/holoviews/core/util.py:1640, in resolve_dependent_value(value)
   1638     value = value()
   1639 elif isinstance(value, param.Parameter) and isinstance(value.owner, param.Parameterized):
-> 1640     value = getattr(value.owner, value.name)
   1641 elif isinstance(value, FunctionType) and hasattr(value, '_dinfo'):
   1642     deps = value._dinfo

File ~/miniforge3/envs/coringa/lib/python3.9/site-packages/param/__init__.py:842, in Number.__get__(self, obj, objtype)
    837 def __get__(self, obj, objtype):
    838     """
    839     Same as the superclass's __get__, but if the value was
    840     dynamically generated, check the bounds.
    841     """
--> 842     result = super(Number, self).__get__(obj, objtype)
    843     # Should be able to optimize this commonly used method by
    844     # avoiding extra lookups (e.g. _value_is_dynamic() is also
    845     # looking up 'result' - should just pass it in).
    846     if self._value_is_dynamic(obj, objtype):

File ~/miniforge3/envs/coringa/lib/python3.9/site-packages/param/__init__.py:613, in Dynamic.__get__(self, obj, objtype)
    611     return gen
    612 else:
--> 613     return self._produce_value(gen)

File ~/miniforge3/envs/coringa/lib/python3.9/site-packages/param/__init__.py:651, in Dynamic._produce_value(self, gen, force)
    648     time_fn = self.time_fn
    650 if (time_fn is None) or (not self.time_dependent):
--> 651     value = produce_value(gen)
    652     gen._Dynamic_last = value
    653 else:

File ~/miniforge3/envs/coringa/lib/python3.9/site-packages/param/__init__.py:75, in produce_value(value_obj)
     69 """
     70 A helper function that produces an actual parameter from a stored
     71 object: if the object is callable, call it, otherwise return the
     72 object.
     73 """
     74 if callable(value_obj):
---> 75     return value_obj()
     76 else:
     77     return value_obj

File ~/miniforge3/envs/coringa/lib/python3.9/site-packages/hvplot/interactive.py:508, in Interactive.__call__(self, *args, **kwargs)
    506         return self._clone(*args, **kwargs)
    507     # TODO: When is this error raised?
--> 508     raise AttributeError
    509 elif self._method == 'plot':
    510     # This - {ax: get_ax} - is passed as kwargs to the plot method in
    511     # the dim expression.
    512     kwargs['ax'] = self._get_ax_fn()

AttributeError:
Any cool idea on how to do that?