I have a dataset that contains many numeric attributes of different distributions.
In [1]: import pandas as pd
   ...: import numpy as np
   ...: import holoviews as hv
   ...: import hvplot.pandas # noqa
   ...: import feather
   ...: hv.extension("bokeh","plotly")
In [2]: df = pd.read_feather("../df_discourse_question1.feather")
In [3]: df
Out[3]:
     mean radius  mean texture  mean perimeter  mean area  mean smoothness  mean compactness  mean concavity  ...  worst compactness  worst concavity  worst concave points  worst symmetry  worst fractal dimension  target  target_name
0          17.99         10.38          122.80     1001.0          0.11840           0.27760         0.30010  ...            0.66560           0.7119                0.2654          0.4601                  0.11890       0       benign
1          20.57         17.77          132.90     1326.0          0.08474           0.07864         0.08690  ...            0.18660           0.2416                0.1860          0.2750                  0.08902       0       benign
2          19.69         21.25          130.00     1203.0          0.10960           0.15990         0.19740  ...            0.42450           0.4504                0.2430          0.3613                  0.08758       0       benign
3          11.42         20.38           77.58      386.1          0.14250           0.28390         0.24140  ...            0.86630           0.6869                0.2575          0.6638                  0.17300       0       benign
4          20.29         14.34          135.10     1297.0          0.10030           0.13280         0.19800  ...            0.20500           0.4000                0.1625          0.2364                  0.07678       0       benign
..           ...           ...             ...        ...              ...               ...             ...  ...                ...              ...                   ...             ...                      ...     ...          ...
564        21.56         22.39          142.00     1479.0          0.11100           0.11590         0.24390  ...            0.21130           0.4107                0.2216          0.2060                  0.07115       0       benign
565        20.13         28.25          131.20     1261.0          0.09780           0.10340         0.14400  ...            0.19220           0.3215                0.1628          0.2572                  0.06637       0       benign
566        16.60         28.08          108.30      858.1          0.08455           0.10230         0.09251  ...            0.30940           0.3403                0.1418          0.2218                  0.07820       0       benign
567        20.60         29.33          140.10     1265.0          0.11780           0.27700         0.35140  ...            0.86810           0.9387                0.2650          0.4087                  0.12400       0       benign
568         7.76         24.54           47.92      181.0          0.05263           0.04362         0.00000  ...            0.06444           0.0000                0.0000          0.2871                  0.07039       1    malignant

[569 rows x 32 columns]
In [7]: df.describe()
Out[7]:
       mean radius  mean texture  mean perimeter    mean area  mean smoothness  mean compactness  mean concavity  ...  worst smoothness  worst compactness  worst concavity  worst concave points  worst symmetry  worst fractal dimension      target
count   569.000000    569.000000      569.000000   569.000000       569.000000        569.000000      569.000000  ...        569.000000         569.000000       569.000000            569.000000      569.000000               569.000000  569.000000
mean     14.127292     19.289649       91.969033   654.889104         0.096360          0.104341        0.088799  ...          0.132369           0.254265         0.272188              0.114606        0.290076                 0.083946    0.627417
std       3.524049      4.301036       24.298981   351.914129         0.014064          0.052813        0.079720  ...          0.022832           0.157336         0.208624              0.065732        0.061867                 0.018061    0.483918
min       6.981000      9.710000       43.790000   143.500000         0.052630          0.019380        0.000000  ...          0.071170           0.027290         0.000000              0.000000        0.156500                 0.055040    0.000000
25%      11.700000     16.170000       75.170000   420.300000         0.086370          0.064920        0.029560  ...          0.116600           0.147200         0.114500              0.064930        0.250400                 0.071460    0.000000
50%      13.370000     18.840000       86.240000   551.100000         0.095870          0.092630        0.061540  ...          0.131300           0.211900         0.226700              0.099930        0.282200                 0.080040    1.000000
75%      15.780000     21.800000      104.100000   782.700000         0.105300          0.130400        0.130700  ...          0.146000           0.339100         0.382900              0.161400        0.317900                 0.092080    1.000000
max      28.110000     39.280000      188.500000  2501.000000         0.163400          0.345400        0.426800  ...          0.222600           1.058000         1.252000              0.291000        0.663800                 0.207500    1.000000

[8 rows x 31 columns]
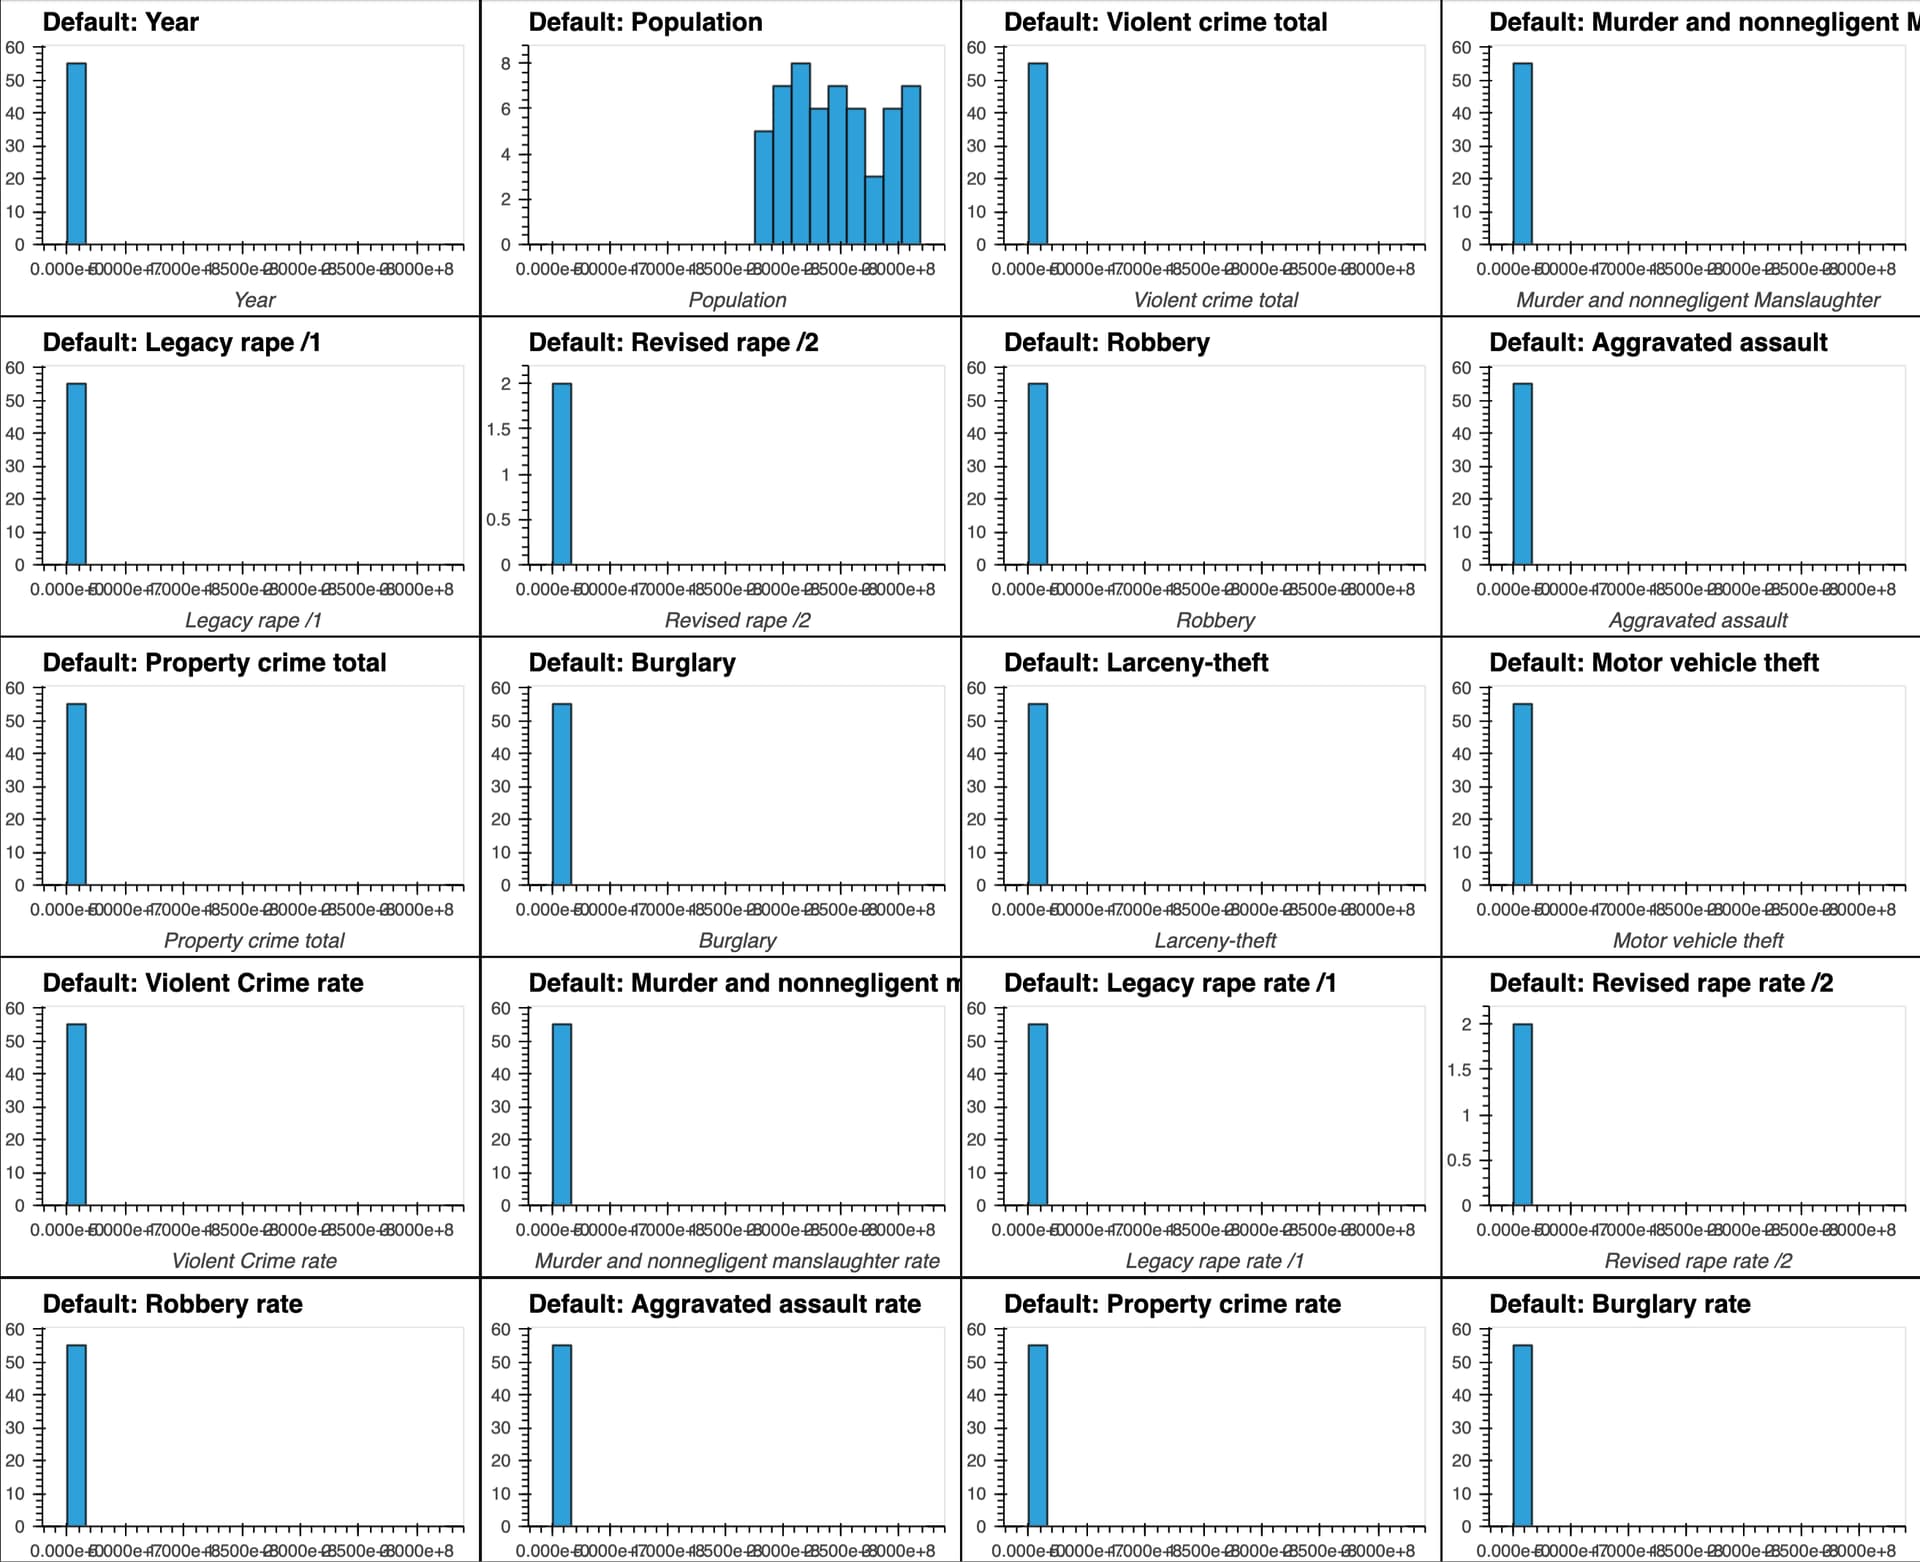
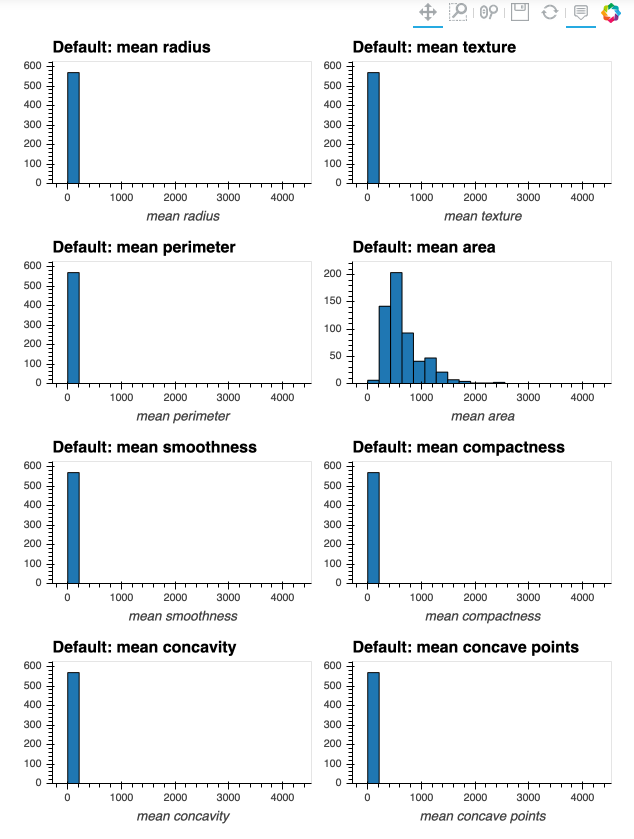
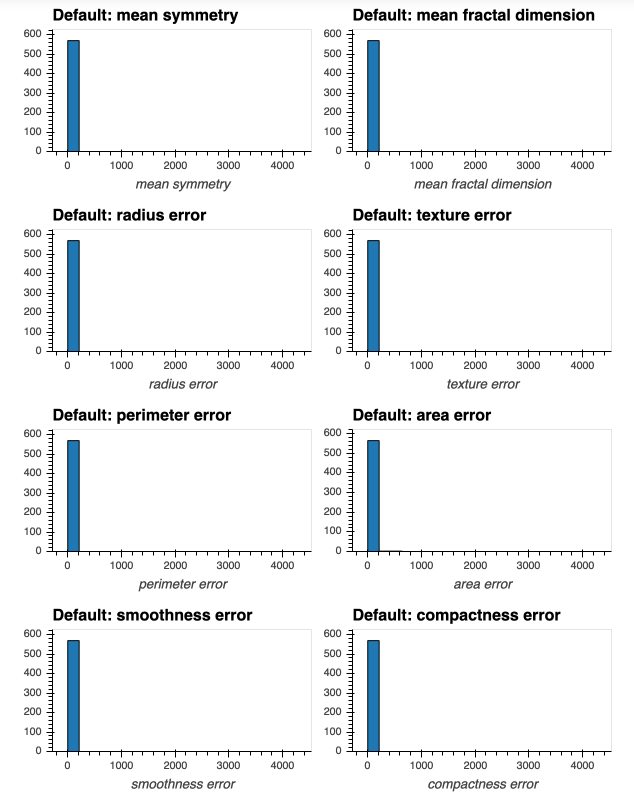
If I attempt to produce histograms for each of the numeric attributes using subplots = True and shared_axes = False , then the subplots are successfully produced, however all of the plots appear to still share an x and y axis:
In [8]: # THIS WILL PRODUCE HISTOGRAMS FOR ALL NUMERIC ATTRIBUTES IN DATAFRAME df, INCLUDING OUR "target" COLUMN:
   ...: df.hvplot.hist(width=300, height=200,
   ...:                subplots=True,
   ...:                shared_axes=False
   ...:               ).cols(2)
Out[8]:
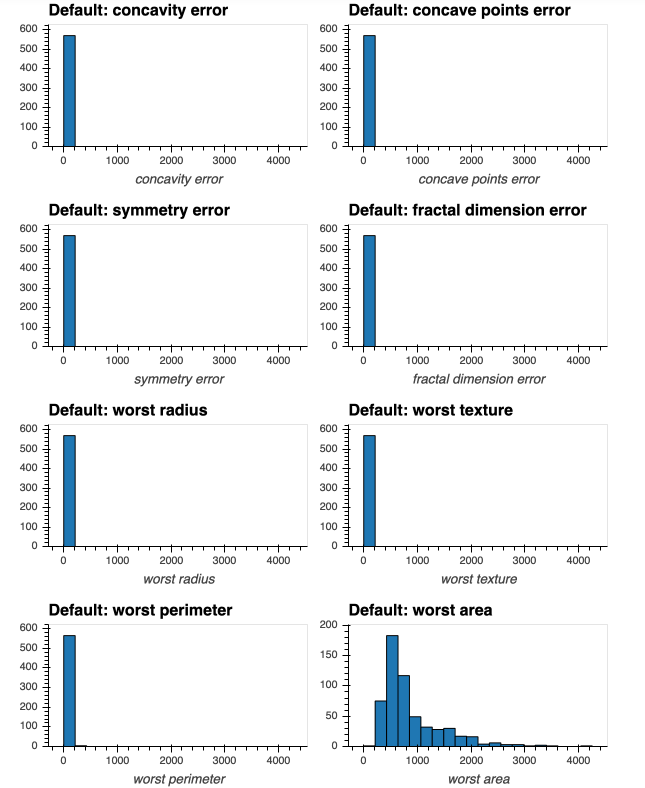
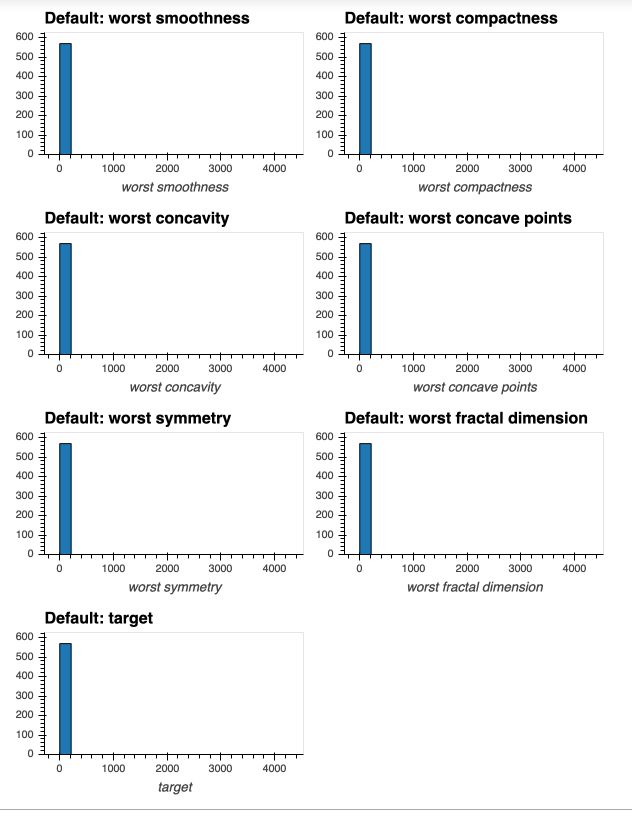
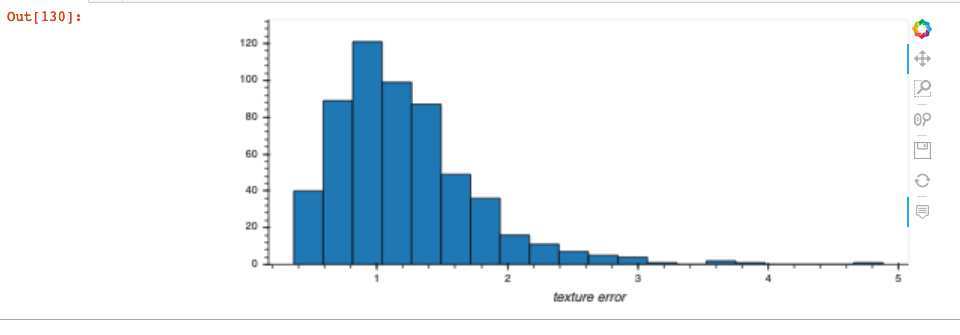
This is confirmed when I produce a single plot for one of the attributes whose histogram above was a single bin - now I can successfully see the distribution of the attribute (due to appropriate x and y axis scale being used on the plot):
In [9]: df.hvplot.hist(y="texture error")
Out[9]:
Does anyone have any idea what is happening here?
Thanks
Software Versions:
pandas                    1.0.3            py37h6c726b0_0
numpy                     1.18.1           py37h7241aed_0
holoviews                 1.13.1                     py_0    pyviz
hvplot                    0.5.2                      py_0    pyviz
feather-format            0.4.0                   py_1003    conda-forge
bokeh                     1.4.0                    py37_0
plotly                    4.5.4                      py_0    plotly