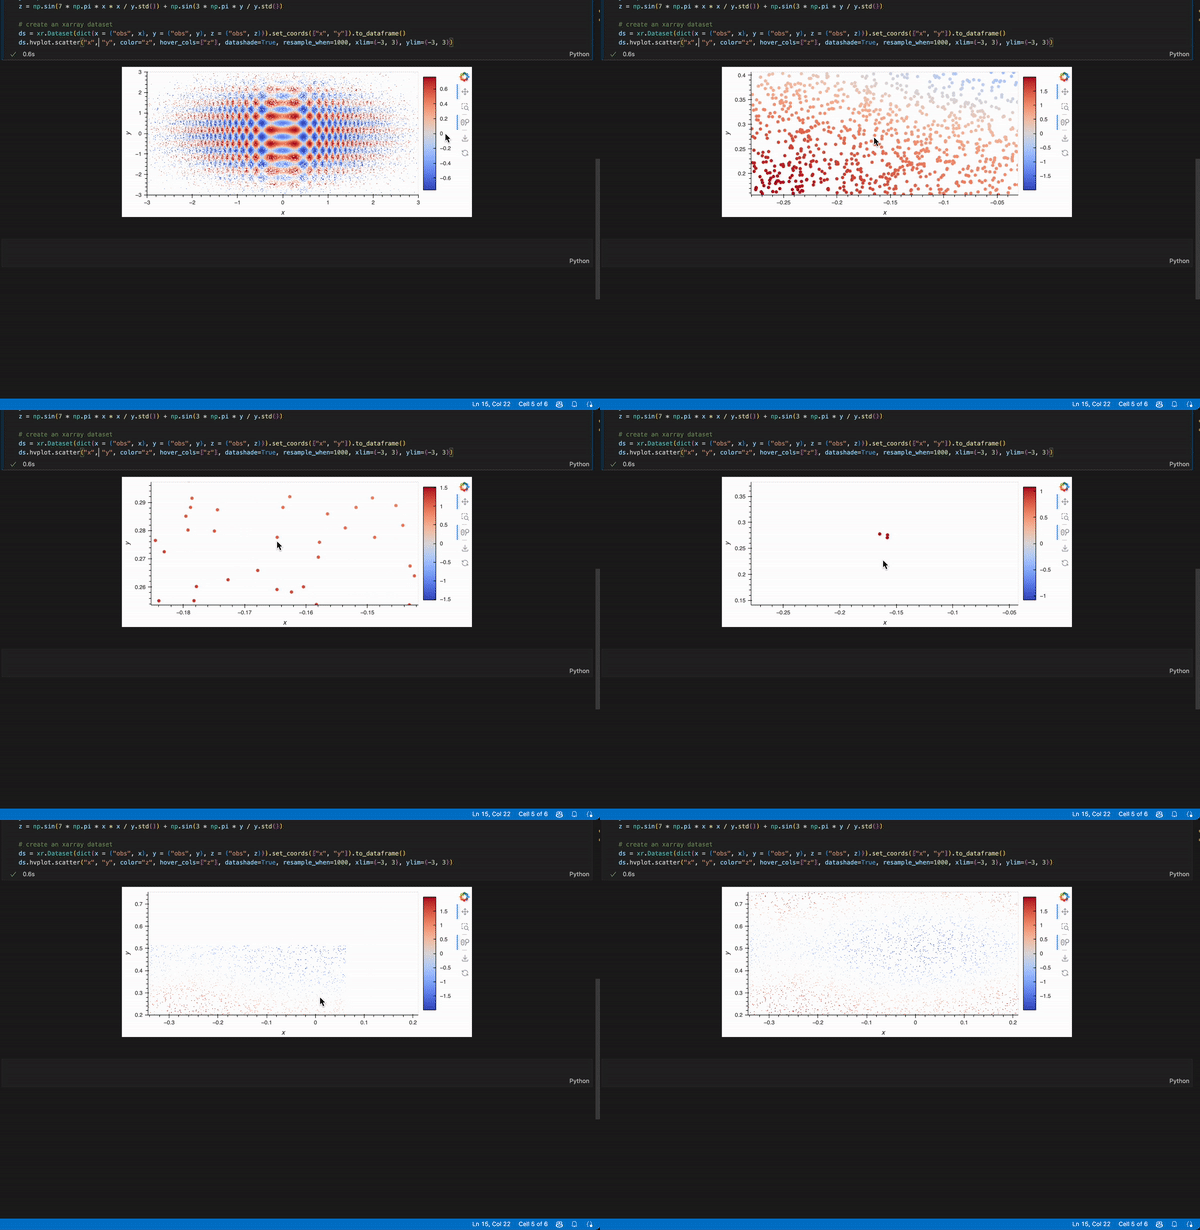
Maybe this? I converted it to a pandas dataframe because hvplot.pandas works better when the dims are 1D while hvplot.xarray works better when dims > 1D
import hvplot.pandas
import xarray as xr
import numpy as np

n = 100000
x = np.random.randn(n)
y = np.random.randn(n)
z = np.sin(7 * np.pi * x * x / y.std()) + np.sin(3 * np.pi * y / y.std())

# create an xarray dataset
ds = xr.Dataset(dict(x = ("obs", x), y = ("obs", y), z = ("obs", z))).set_coords(["x", "y"]).to_dataframe()
ds.hvplot.scatter("x", "y", color="z", hover_cols=["z"], datashade=True, resample_when=1000, xlim=(-3, 3), ylim=(-3, 3))

(To get hover, you can use rasterize=True instead of datashade)