Show individual points when zoomed, else datashade

Making sure this doesn’t get lost because it’s too cool!
zoom_hover

points = hv.Points(np.random.multivariate_normal((0,0), [[0.1, 0.1], [0.1, 1.0]], (500000,)))


def filter_points(points, x_range, y_range):
    if x_range is None or y_range is None:
        return points
    return points[x_range, y_range]

def hover_points(points, threshold=5000):
    if len(points) > threshold:
        return points.iloc[:0]
    return points

range_stream = hv.streams.RangeXY(source=points)
streams=[range_stream]

filtered = points.apply(filter_points, streams=streams)
shaded = datashade(filtered, width=400, height=400, streams=streams)
hover = filtered.apply(hover_points)

dynamic_hover = (shaded * hover).opts(
    hv.opts.Points(tools=['hover'], alpha=0.1, hover_alpha=0.2, size=10))
6 Likes

Would be cool if users can just set some keyword to True and all this magic happens

1 Like

I’d be happy to see that in hvplot. Maybe datashade=5000 or rasterize=5000 instead of datashade=True or rasterize=True, indicating that if there are more than 5000 points visible in the current viewport then datashade it, else use raw Bokeh plotting? There are various complications like categorical plotting (supported very differently in datashader and bokeh), styling (colors, sizes, etc.). But in principle, yes.

4 Likes

Worth noting that there’s now a helper for this in the form of apply_when:

import holoviews as hv

from holoviews.operation.datashader import rasterize
from holoviews.operation import apply_when

points = hv.Points(np.random.randn(100000, 2))

apply_when(points, operation=rasterize, predicate=lambda x: len(x) > 5000)
4 Likes

Is there a way to apply x_sampling + y_sampling using this method?

Oh just wrap a function

    def _rasterize_new(self, points):
        return rasterize(points, x_sampling=0.25, y_sampling=0.25, aggregator="max")

apply_when(points, operation=self._rasterize_new, predicate=lambda x: len(x) > 5000)

But maybe apply_when can accept **kwds?

1 Like

You can make an instance of any operation and override kwargs like this:

my_custom_rasterize = rasterize.instance(x_sampling=0.25, y_sampling=0.25, aggregator="max")
2 Likes

Thanks, learning a lot of new stuff!

I thought updating to this method would fix this: datashading error when zoomed on region without any points (maybe geoviews projection + responsive too) · Issue #4910 · holoviz/holoviews · GitHub, but I am still encountering

boundsspec2slicespec
    t_idx = int(np.ceil(t_m-0.5))
ValueError: cannot convert float NaN to integer
1 Like

Is it possible to pre-show the colorbar initially if the number of points doesn’t meet the threshold, until data continues to stream

1 Like

Is there a way to do this with multiple categories of points? Or on a map?
I am not too familiar with Datashader so this is quite cool!

1 Like

Yes, you can do it with multiple points, and it is now implemented directly in hvplot.

import pandas as pd
import numpy as np
import hvplot.pandas

df = pd.DataFrame(
    np.random.multivariate_normal((0, 0), [[0.1, 0.1], [0.1, 1.0]], (5000,))
).rename({0: "x", 1: "y"}, axis=1)
df2 = pd.DataFrame(
    np.random.multivariate_normal((0, 0), [[0.1, 0.1], [0.1, 1.0]], (5000,))
).rename({0: "x", 1: "y"}, axis=1)
point1 = df.hvplot(kind=kind, x="x", y="y", resample_when=1000, rasterize=True)
point2 = df2.hvplot(kind=kind, x="x", y="y", resample_when=1000, rasterize=True)
point1 * point2
2 Likes

Hi,

This sounds so cool!

What if you have a third variable? Let’s suppose that x and y are spatial positions and you have a third variable z. I want that the aggregation shows the average z for the bins and as we zoom in, we show individual xs and ys with the respective color representing the variable z. Is that possible?

I don’t fully understand, but I’m pretty sure it’s possible if you fallback to the HoloViews level and define your callbacks manually (seen in the first post of this thread).

Or, as I’m re-reading, if you want to simply average the aggregation, you pass aggregator="mean". More info here; Customization — hvPlot 0.9.0 documentation

This might be a too naive question and sorry about that.
I am new to holoviz world and most of my experience is with matplotlib.
As I am more of a xarray person than pandas, here is my example:

import hvplot.xarray
import xarray as xr
import numpy as np

n = 100000
x = np.random.randn(n)
y = np.random.randn(n)
z = np.sin(7 * np.pi * x * x / y.std()) + np.sin(3 * np.pi * y / y.std())

# create an xarray dataset
ds = xr.Dataset(dict(x = ("obs", x), y = ("obs", y), z = ("obs", z))).set_coords(["x", "y"])

This creates a Dataset that has only one variable z with a single dimension obs and two coordinates x and y. What I usually do is:

ds.plot.scatter(x = "x", y = "y", hue = "z", alpha = 0.5)

Which returns a matplotlib plot like this:

image

But what I want to do is to plot this using hvplot and datashader. The plot will show average z values for x and y bins and if I zoom in, it will change the bins to smaller sizes, highlighting the smaller-scale features. If I zoom “too much”, it will show separate points as you showed in the original post. Is there an easy way to do that?

It is being some days I’ve been reading the docs and despite I think these are wonderful packages, they are many and I have not seen an example like that. This is very useful for spatial data science and I can see many benefits of doing that, specially if the data is somehow lazily loaded into the memory depending on the zoom etc.

If we can come up with an example for this, I promise to organize that and add it to the gallery.

1 Like

Maybe this? I converted it to a pandas dataframe because hvplot.pandas works better when the dims are 1D while hvplot.xarray works better when dims > 1D

import hvplot.pandas
import xarray as xr
import numpy as np

n = 100000
x = np.random.randn(n)
y = np.random.randn(n)
z = np.sin(7 * np.pi * x * x / y.std()) + np.sin(3 * np.pi * y / y.std())

# create an xarray dataset
ds = xr.Dataset(dict(x = ("obs", x), y = ("obs", y), z = ("obs", z))).set_coords(["x", "y"]).to_dataframe()
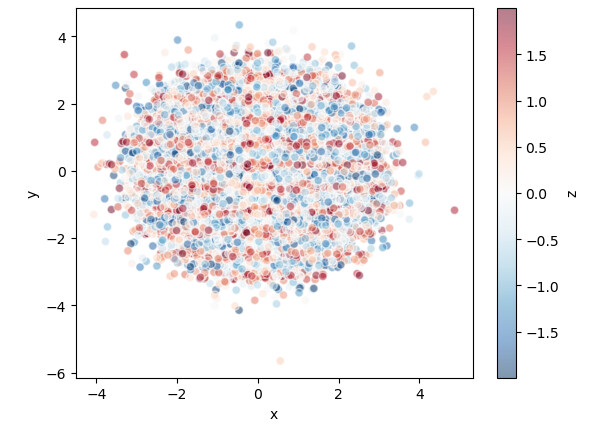
ds.hvplot.scatter("x", "y", color="z", hover_cols=["z"], datashade=True, resample_when=1000, xlim=(-3, 3), ylim=(-3, 3))

resample_when

(To get hover, you can use rasterize=True instead of datashade)

2 Likes

Cool! I will prepare an example using some real data!

Just a quick question, in my case, I am receiving the following message:

WARNING:param.main: resample_when option not found for scatter plot with bokeh; similar options include: []

Oh it was recently released in hvplot 0.9.0, so pip install -U hvplot

2 Likes