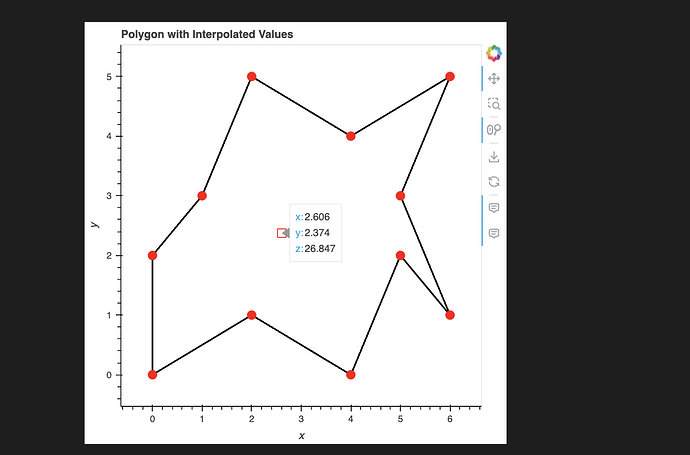
Show interpolated vertex values of Polgyon on hover

I have working code to interpolate a polygons vertices values below. My approach was to use a grid and scipy interpolate to get the values over the grid. I then use a QuadMesh with alpha=0 to hide the quadmesh but have enabled hover to display the values.

This works but the quadmesh covers the entire bounds of the polygon (max/min) so the values outside are masked to be Nans and I am looking for a way to turn off hover when mousing outside the polygons.

Any suggestions or am I down the wrong path?

#%%
import holoviews as hv
import numpy as np
import pandas as pd
from scipy.interpolate import LinearNDInterpolator
from shapely.geometry import Polygon, Point

# Enable bokeh plotting extension
hv.extension('bokeh')

def create_interpolated_polygon_plot(vertices, values):
    # Create a Shapely polygon
    poly = Polygon(vertices)
    
    # Create a LinearNDInterpolator
    interp = LinearNDInterpolator(vertices, values)

    # Function to generate interpolated values
    def interpolate_values(xs, ys):
        points = np.column_stack([xs, ys])
        return interp(points)

    # Get bounding box of the polygon
    minx, miny, maxx, maxy = poly.bounds

    # Create a grid of points
    x = np.linspace(minx, maxx, 100)
    y = np.linspace(miny, maxy, 100)
    xx, yy = np.meshgrid(x, y)

    # Create a mask for points inside the polygon
    points = np.column_stack([xx.ravel(), yy.ravel()])
    mask = np.array([poly.contains(Point(p)) for p in points])

    # Interpolate values for all points
    zz = interpolate_values(xx.ravel(), yy.ravel())

    # Apply the mask
    zz[~mask] = np.nan
    zz = zz.reshape(xx.shape)

    # Create the heatmap using HoloViews QuadMesh
    heatmap = hv.QuadMesh((x, y, zz)).opts(
        alpha=0,
        width=500,
        height=500,
        title='Interpolated Values Heatmap',
        tools=['hover'],
        clipping_colors={'NaN': 'transparent'}
    )

    # Create the polygon outline
    polygon_outline = hv.Polygons([vertices]).opts(
        fill_alpha=0,
        line_color='black',
        line_width=2
    )

    # Create points for the vertices
    vertex_points = hv.Points(
        data=pd.DataFrame({
            'x': [v[0] for v in vertices],
            'y': [v[1] for v in vertices],
            'z': values
        }),
        kdims=['x', 'y'],
        vdims=['z']
    ).opts(
        color='red',
        size=10,
        tools=['hover'],
        hover_tooltips=[('value', '@z{0.2f}')]
    )

    # Combine the heatmap, polygon outline, and vertex points
    plot = (heatmap * polygon_outline * vertex_points).opts(
        width=500,
        height=500,
        title='Polygon with Interpolated Values',
        tools=['hover'],
    )

    return plot

# Example usage with a complex polygon (11 vertices)
vertices = [
    (0, 0), (2, 1), (4, 0), (5, 2), (6, 1),
    (5, 3), (6, 5), (4, 4), (2, 5), (1, 3), (0, 2)
]
values = [10, 25, 15, 30, 20, 35, 40, 30, 45, 25, 15]

plot = create_interpolated_polygon_plot(vertices, values)
plot
# %%
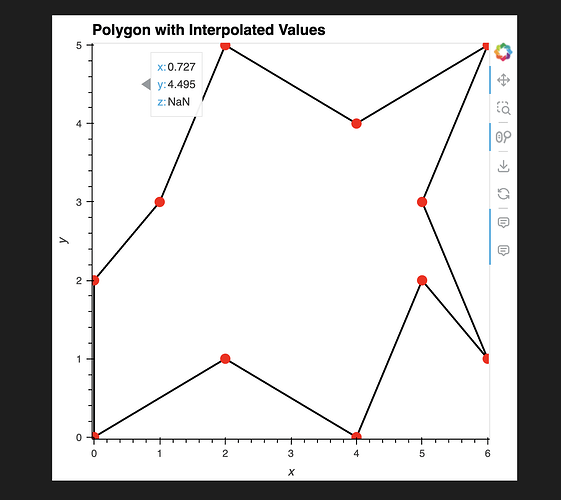
Don’t think it’s possible yet to hide tooltips where value is NaN, but perhaps you can raise an issue on Bokeh GitHub to request it?

As a workaround, you can use popup to manually click, find nearest point, and show the value Custom Interactivity — HoloViews v1.19.1

However, this requires a server.

I suppose one thing you can try is a custom HTML hover tooltip

https://examples.holoviz.org/gallery/ship_traffic/ship_traffic.html#selecting-specific-datapoints

vtypes_copy = vessel_types.copy()
vtypes_copy['VesselType'] = vtypes_copy['num'] 
mmsi_vessels_df = vessels[['MMSI', 'VesselName', 'VesselType']].copy()
mmsi_mapping_df = mmsi_vessels_df.merge(vtypes_copy, on='VesselType')
mmsi_mapping_df['ShipType'] = mmsi_mapping_df['VesselType'].apply(lambda x: category_desc(categories[x]))
MAPPING = {int(el['MMSI']):str(el['VesselName'])+' : '+el['ShipType'] for el in mmsi_mapping_df[['MMSI', 'VesselName', 'ShipType']].to_dict(orient='records')}
def lookup_hook(plot, element):
    test = CustomJSHover(
        code=f"""
        const mapping = {MAPPING};
        if ( value in mapping ) {{
          return mapping[value].toString()
        }}
        return "No ship info"
    """
    )

    plot.handles["hover"].tooltips.pop()  # The index
    plot.handles["hover"].tooltips.append(("Ship", "@image{custom}"))
    plot.handles["hover"].formatters["@image"] = test

vessel_name_raster = rasterize(hv.Points(df, vdims=['MMSI']).redim.range(**loc['Vancouver Area']) , 
                                         aggregator=ds.max('MMSI')).opts(tools=["hover"], hooks=[lookup_hook], alpha=0

If it’s a NaN return an empty div

1 Like

Oh maybe this is relevant

ooh thats new… that popup feature. I’ll try it out as an alternative

Nice. Thanks for bokeh link. I was able to try that out. If I return empty div it still displays a blank popup however setting to None brought up no popup.
I’ll have to try it with the ship example you point me to. Thanks

1 Like

however setting to None brought up no popup.

Good to know! However, I’m wondering how would you control it per x/y coordinate? If I set it to None, all of them show nothing

So it might need to be a Bokeh issue after all.

And the winner is the holoviews streams popup. I think users will be ok with clicking. Its not as streamlined as the hover but it will get the job done. Return None in this case removes the popup completely

# %%
import geoviews as gv
import holoviews as hv
import panel as pn
from holoviews.streams import PointerXY

# Enable the necessary extensions
hv.extension("bokeh")
gv.extension("bokeh")

# Create a map tile source
tiles = gv.tile_sources.OSM


# Create a pointer stream to capture click events
def popup_latlon(x, y):
    lon, lat = hv.util.transform.easting_northing_to_lon_lat(x, y)
    print(lon, lat)
    if lon > 0 and lon < 50:
        return f"Latitude: {lat:.5f}, Longitude: {lon:.5f}"
    else:
        return None  # "Sorry, no data for this location"


# Combine the map and coordinate display
layout = tiles.opts(
    tools=["tap"], width=800, height=500, title="Click on the map to see coordinates"
)
tap = hv.streams.Tap(popup=popup_latlon, source=layout)

# Create a Panel app
app = pn.Column(pn.pane.Markdown("# Interactive Map Coordinate Viewer"), layout)

# Serve the app
if __name__ == "__main__":
    app.show()
1 Like

Return None in this case removes the popup completely

Yep that was part of the design :smiley:

I wonder if it’s possible to use CrossHair for popup…

# %%
import holoviews as hv
import numpy as np
import pandas as pd
import holoviews.operation.datashader as hd
from holoviews.operation.datashader import datashade
from scipy.interpolate import LinearNDInterpolator
from shapely.geometry import Polygon, Point

# Enable bokeh plotting extension
hv.extension("bokeh")


def create_interpolated_polygon_plot(vertices, values):
    # Create a Shapely polygon
    poly = Polygon(vertices)

    # Create a LinearNDInterpolator
    interp = LinearNDInterpolator(vertices, values)

    # Function to generate interpolated values
    def interpolate_values(xs, ys):
        points = np.column_stack([xs, ys])
        return interp(points)

    # Get bounding box of the polygon
    minx, miny, maxx, maxy = poly.bounds

    # Create a grid of points
    x = np.linspace(minx, maxx, 100)
    y = np.linspace(miny, maxy, 100)
    xx, yy = np.meshgrid(x, y)

    # Create a mask for points inside the polygon
    points = np.column_stack([xx.ravel(), yy.ravel()])
    mask = np.array([poly.contains(Point(p)) for p in points])

    # Interpolate values for all points
    zz = interpolate_values(xx.ravel(), yy.ravel())

    # Apply the mask
    zz[~mask] = np.nan
    zz = zz.reshape(xx.shape)

    # Create the heatmap using HoloViews QuadMesh
    heatmap = hv.QuadMesh((x, y, zz)).opts(
        alpha=0,
        width=500,
        height=500,
        title="Interpolated Values Heatmap",
        clipping_colors={"NaN": "transparent"},
    )

    # Create the polygon outline
    polygon_outline = hv.Polygons([vertices]).opts(
        fill_alpha=0, line_color="black", line_width=2
    )

    # Create points for the vertices
    vertex_points = hv.Points(
        data=pd.DataFrame(
            {"x": [v[0] for v in vertices], "y": [v[1] for v in vertices], "z": values}
        ),
        kdims=["x", "y"],
        vdims=["z"],
    ).opts(
        color="red", size=10, tools=["hover"], hover_tooltips=[("value", "@z{0.2f}")]
    )

    highlighter = hd.inspect_points.instance(streams=[hv.streams.PointerXY])
    highlight = highlighter(heatmap).opts(
        color="red", tools=["hover"], marker="square", size=10, fill_alpha=0
    )

    # Combine the heatmap, polygon outline, and vertex points
    plot = (highlight * heatmap * polygon_outline * vertex_points).opts(
        width=500,
        height=500,
        title="Polygon with Interpolated Values",
        tools=["hover"],
    )

    return plot


# Example usage with a complex polygon (11 vertices)
vertices = [
    (0, 0),
    (2, 1),
    (4, 0),
    (5, 2),
    (6, 1),
    (5, 3),
    (6, 5),
    (4, 4),
    (2, 5),
    (1, 3),
    (0, 2),
]
values = [10, 25, 15, 30, 20, 35, 40, 30, 45, 25, 15]

plot = create_interpolated_polygon_plot(vertices, values)
plot

This seems to do the trick!

1 Like