Hello All,
I am trying to integrate the following EChart to a panel template: Examples - Apache ECharts
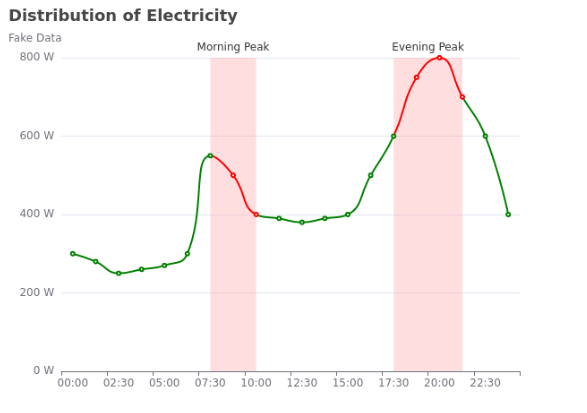
As you can see from the official website, for visualMap, there is an option show which is false. If you switch it to true, you can see that the effect is to add the delimitation info used to define the areas in the chart.
However, in panel, the option show: false doesn’t work, as it still show the delimitation info.
Here is the code I use:
import panel as pn
pn.extension(sizing_mode="stretch_width")


echart_demo = {
    'title': {
        'text': 'Distribution of Electricity',
        'subtext': 'Fake Data'
    },
    'tooltip': {
        'trigger': 'axis',
        'axisPointer': {
            'type': 'cross'
        }
    },
    'xAxis': {
        'type': 'category',
        'boundaryGap': 'false',
        'data': ['00:00', '01:15', '02:30', '03:45', '05:00', '06:15', '07:30', '08:45', '10:00', '11:15', '12:30', '13:45', '15:00', '16:15', '17:30', '18:45', '20:00', '21:15', '22:30', '23:45']
    },
    'yAxis': {
        'type': 'value',
        'axisLabel': {
            'formatter': '{value} W'
        },
        'axisPointer': {
            'snap': 'true'
        }
    },
    'visualMap': {
        'show': 'false',
        'dimension': 0,
        'pieces': [
            {
                'lte': 6,
                'color': 'green'
            },
            {
                'gt': 6,
                'lte': 8,
                'color': 'red'
            },
            {
                'gt': 8,
                'lte': 14,
                'color': 'green'
            },
            {
                'gt': 14,
                'lte': 17,
                'color': 'red'
            },
            {
                'gt': 17,
                'color': 'green'
            }
        ]
    },
    'series': [
        {
            'name': 'Electricity',
            'type': 'line',
            'smooth': 'true',
            'data': [300, 280, 250, 260, 270, 300, 550, 500, 400, 390, 380, 390, 400, 500, 600, 750, 800, 700, 600, 400],
            'markArea': {
                'itemStyle': {
                    'color': 'rgba(255, 173, 177, 0.4)'
                },
                'data': [
                    [
                        {
                          'name': 'Morning Peak',
                          'xAxis': '07:30'
                        },
                        {
                          'xAxis': '10:00'
                        }
                    ],
                    [
                        {
                            'name': 'Evening Peak',
                            'xAxis': '17:30'
                        },
                        {
                            'xAxis': '21:15'
                        }
                    ]
                ]
            }
        }
    ]
}

echart_pane = pn.pane.ECharts(echart_demo, height=480, width=640)

template = pn.template.FastListTemplate(
    site="Demo energy consumption",
    title="",
    main=[pn.Row(echart_pane)]
)

template.servable()
And the effect can be seen here in bottom-left corner:
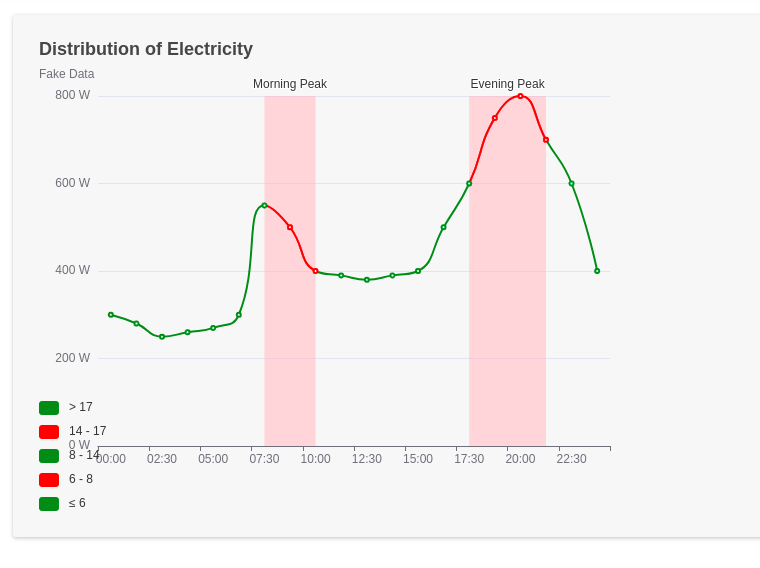
Any advice how to hide this “legend” are appreciated.
Thank you in advance!
Br, Sorin