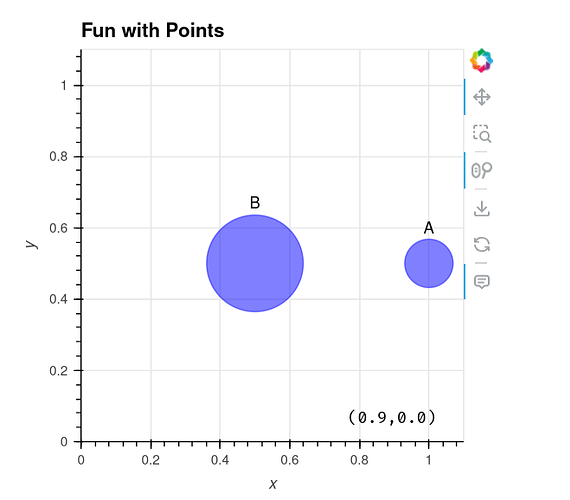
A fun starter template for plotting holoviews points in the domain of ((0,1),(0,1)) with appropriately placed labels.
import holoviews as hv
hv.extension('bokeh')

import pandas as pd

nodes = [
    {
        'name': 'A',
        'x': 1,
        'y': 0.5,
        'size': 0.1,
        'agent_type': 'Node',
    },
    {
        'name': 'B',
        'x': 0.5,
        'y': 0.5,
        'size': 0.2,
        'agent_type': 'Node',
    }
]

# Convert to DataFrame
nodes_df = pd.DataFrame(nodes)

# Adjust the y-coordinate of labels by the size of the point (scaled appropriately)
label_offset = 0.7  # Adjust this multiplier for finer control
nodes_df['y_label'] = nodes_df['y'] + nodes_df['size'] * label_offset

# Create Points plot and include 'agent_type' in vdims
points = hv.Points(nodes_df, kdims=['x', 'y'], vdims=['name', 'size', 'agent_type'])

# Create Points plot and include 'agent_type' in vdims, and scale size properly
points = hv.Points(nodes_df, kdims=['x', 'y'], vdims=['name', 'size', 'agent_type'])

# Define labels to appear above the points
labels = hv.Labels(nodes_df, kdims=['x', 'y_label'], vdims='name').opts(
    text_align='center',       # Align text to center above points
    text_baseline='bottom',    # Position the text above the points
    text_font_size='10pt',
    text_color='black'
)

# Define a stream to track mouse position
pointer = hv.streams.PointerXY(x=0, y=0)

# Define a dynamic label that shows x and y coordinates from the stream
xy_label = hv.DynamicMap(lambda x, y: hv.Text(x, y, f'({x:.1f},{y:.1f})\n\n'), streams=[pointer])
xy_label.opts(text_font='Courier')

# Combine points with the dynamic label
plot = points * xy_label * labels

# Set your normalized plot size to work in the (0,1) coordinate system
plot_width = 400
plot_height = 400
xlim = (0, 1.1)
ylim = (0, 1.1)

# Calculate scaling factor based on plot dimensions
scaling_factor = min(plot_width, plot_height)  # This will ensure size fits in plot's pixel dimensions

# Customize the hover tool to show 'Name' and 'agent_type'
plot.opts(
    hv.opts.Points(
        alpha=0.5,
        size=hv.dim('size') * scaling_factor,  # Apply scaling factor to the 'size' dimension
        color='blue',
        show_grid=True,
        hover_tooltips=[('Name', '@name'), ('Agent Type', '@agent_type')],
        xlim=xlim,
        ylim=ylim,
        width=plot_width,
        height=plot_height
    ),
    hv.opts.Text(text_font_size='10pt', text_color='black')
I’ll be using this as a starter template in future work. I’ve also created a gist here: Simple but Powerful usage of Holoviews Points · GitHub
