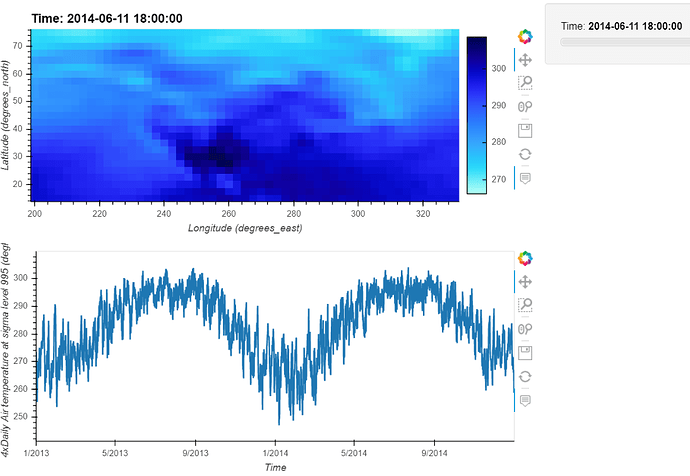
I haven’t learned how to use panel’s latest methods, but this is how I did it:
import panel as pn
import numpy as np
import xarray as xr
import holoviews as hv
import hvplot.xarray

pn.extension()

ds = xr.tutorial.open_dataset('air_temperature')
image = ds.hvplot('lon', 'lat')
stream = hv.streams.Tap(source=image, x=-88 + 360, y=40)

@pn.depends(stream.param.x, stream.param.y)
def timeseries(x, y):
    return ds.sel(lon=x, lat=y, method='nearest').hvplot('time')

pn.Column(image, timeseries)
modified from Example of using holoviews TapStream with Panel
