Simple Panel example of map/time series interaction for data cube?

A lot of folks have time stacks of imagery data (data cubes) and seems like a common use case would be to make a map, click a location on the map and see a time series from that spot.

Our Google Summer of Code student wrote xrviz which does this, but it’s pretty complex, using a SigSlot library, which I’m not sure is the latest best practice for building Panel apps like this.

Does anyone have a simple example of this type of Panel app?

3 Likes

I haven’t learned how to use panel’s latest methods, but this is how I did it:

import panel as pn
import numpy as np
import xarray as xr
import holoviews as hv
import hvplot.xarray

pn.extension()

ds = xr.tutorial.open_dataset('air_temperature')
image = ds.hvplot('lon', 'lat')
stream = hv.streams.Tap(source=image, x=-88 + 360, y=40)

@pn.depends(stream.param.x, stream.param.y)
def timeseries(x, y):
    return ds.sel(lon=x, lat=y, method='nearest').hvplot('time')

pn.Column(image, timeseries)

modified from Example of using holoviews TapStream with Panel

3 Likes

Thanks, @ahuang11! If you want to see how it looks using pn.bind from panel 0.10.1 instead of @depends, it’s just:

import panel as pn
import numpy as np
import xarray as xr
import holoviews as hv
import hvplot.xarray

pn.extension()

ds = xr.tutorial.open_dataset('air_temperature')
image = ds.hvplot('lon', 'lat')
stream = hv.streams.Tap(source=image, x=-88 + 360, y=40)

def timeseries(x, y):
    return ds.sel(lon=x, lat=y, method='nearest').hvplot('time')

pn.Column(image, pn.bind(timeseries, x=stream.param.x, y=stream.param.y))

I.e., basically the same, but now you can write your callback function as just a regular Python function now, with no decorator, and then later bind its arguments to widgets or to stream parameters when you want to put it in a panel.

[UPDATED with working code; I needed to add .dmap()]
You can also write this even more simply using the new .interactive support in hvPlot, which lets you eliminate the callback entirely:

import panel as pn
import numpy as np
import xarray as xr
import holoviews as hv
import hvplot.xarray

pn.extension()

ds = xr.tutorial.open_dataset('air_temperature')
image = ds.hvplot('lon', 'lat')
stream = hv.streams.Tap(source=image, x=-88+360, y=40)
timeseries = ds.interactive.sel(lon=stream.param.x, lat=stream.param.y,
                                method="nearest").hvplot('time')

pn.Column(image, timeseries.dmap())
4 Likes

@jbednar, this works great, but if I change the slider widget to “Select” using widgets={'time':pn.widgets.Select} thusly, it bombs:

import panel as pn
import numpy as np
import xarray as xr
import holoviews as hv
import hvplot.xarray

pn.extension()

ds = xr.tutorial.open_dataset('air_temperature')
image = ds.hvplot('lon', 'lat', widgets={'time':pn.widgets.Select})
stream = hv.streams.Tap(source=image, x=-88 + 360, y=40)

def timeseries(x, y):
    return ds.sel(lon=x, lat=y, method='nearest').hvplot('time')

pn.Column(image, pn.bind(timeseries, x=stream.param.x, y=stream.param.y))

with the error:

---------------------------------------------------------------------------
AttributeError                            Traceback (most recent call last)
/home/conda/store/5413108540ec5590442f729933018374edec0237f31b6b39bdb179c9e72aa025-pangeo/lib/python3.7/site-packages/IPython/core/formatters.py in __call__(self, obj, include, exclude)
    968 
    969             if method is not None:
--> 970                 return method(include=include, exclude=exclude)
    971             return None
    972         else:

/home/conda/store/5413108540ec5590442f729933018374edec0237f31b6b39bdb179c9e72aa025-pangeo/lib/python3.7/site-packages/panel/viewable.py in _repr_mimebundle_(self, include, exclude)
    571         doc = _Document()
    572         comm = state._comm_manager.get_server_comm()
--> 573         model = self._render_model(doc, comm)
    574         ref = model.ref['id']
    575         manager = CommManager(comm_id=comm.id, plot_id=ref)

/home/conda/store/5413108540ec5590442f729933018374edec0237f31b6b39bdb179c9e72aa025-pangeo/lib/python3.7/site-packages/panel/viewable.py in _render_model(self, doc, comm)
    422         if comm is None:
    423             comm = state._comm_manager.get_server_comm()
--> 424         model = self.get_root(doc, comm)
    425 
    426         if config.embed:

/home/conda/store/5413108540ec5590442f729933018374edec0237f31b6b39bdb179c9e72aa025-pangeo/lib/python3.7/site-packages/panel/viewable.py in get_root(self, doc, comm, preprocess)
    480         """
    481         doc = init_doc(doc)
--> 482         root = self._get_model(doc, comm=comm)
    483         if preprocess:
    484             self._preprocess(root)

/home/conda/store/5413108540ec5590442f729933018374edec0237f31b6b39bdb179c9e72aa025-pangeo/lib/python3.7/site-packages/panel/layout/base.py in _get_model(self, doc, root, parent, comm)
    110         if root is None:
    111             root = model
--> 112         objects = self._get_objects(model, [], doc, root, comm)
    113         props = dict(self._init_properties(), objects=objects)
    114         model.update(**self._process_param_change(props))

/home/conda/store/5413108540ec5590442f729933018374edec0237f31b6b39bdb179c9e72aa025-pangeo/lib/python3.7/site-packages/panel/layout/base.py in _get_objects(self, model, old_objects, doc, root, comm)
    100             else:
    101                 try:
--> 102                     child = pane._get_model(doc, root, model, comm)
    103                 except RerenderError:
    104                     return self._get_objects(model, current_objects[:i], doc, root, comm)

/home/conda/store/5413108540ec5590442f729933018374edec0237f31b6b39bdb179c9e72aa025-pangeo/lib/python3.7/site-packages/panel/pane/holoviews.py in _get_model(self, doc, root, parent, comm)
    239             plot = self.object
    240         else:
--> 241             plot = self._render(doc, comm, root)
    242 
    243         plot.pane = self

/home/conda/store/5413108540ec5590442f729933018374edec0237f31b6b39bdb179c9e72aa025-pangeo/lib/python3.7/site-packages/panel/pane/holoviews.py in _render(self, doc, comm, root)
    304                 kwargs['comm'] = comm
    305 
--> 306         return renderer.get_plot(self.object, **kwargs)
    307 
    308     def _cleanup(self, root):

/home/conda/store/5413108540ec5590442f729933018374edec0237f31b6b39bdb179c9e72aa025-pangeo/lib/python3.7/site-packages/holoviews/plotting/bokeh/renderer.py in get_plot(self_or_cls, obj, doc, renderer, **kwargs)
     71         combining the bokeh model with another plot.
     72         """
---> 73         plot = super(BokehRenderer, self_or_cls).get_plot(obj, doc, renderer, **kwargs)
     74         if plot.document is None:
     75             plot.document = Document() if self_or_cls.notebook_context else curdoc()

/home/conda/store/5413108540ec5590442f729933018374edec0237f31b6b39bdb179c9e72aa025-pangeo/lib/python3.7/site-packages/holoviews/plotting/renderer.py in get_plot(self_or_cls, obj, doc, renderer, comm, **kwargs)
    234                 obj = Layout(obj)
    235             plot = self_or_cls.plotting_class(obj)(obj, renderer=renderer,
--> 236                                                    **plot_opts)
    237             defaults = [kd.default for kd in plot.dimensions]
    238             init_key = tuple(v if d is None else d for v, d in

/home/conda/store/5413108540ec5590442f729933018374edec0237f31b6b39bdb179c9e72aa025-pangeo/lib/python3.7/site-packages/holoviews/plotting/bokeh/raster.py in __init__(self, *args, **kwargs)
     72 
     73     def __init__(self, *args, **kwargs):
---> 74         super(RasterPlot, self).__init__(*args, **kwargs)
     75         if self.hmap.type == Raster:
     76             self.invert_yaxis = not self.invert_yaxis

/home/conda/store/5413108540ec5590442f729933018374edec0237f31b6b39bdb179c9e72aa025-pangeo/lib/python3.7/site-packages/holoviews/plotting/bokeh/element.py in __init__(self, element, plot, **params)
    204         self.handles = {} if plot is None else self.handles['plot']
    205         self.static = len(self.hmap) == 1 and len(self.keys) == len(self.hmap)
--> 206         self.callbacks = self._construct_callbacks()
    207         self.static_source = False
    208         self.streaming = [s for s in self.streams if isinstance(s, Buffer)]

/home/conda/store/5413108540ec5590442f729933018374edec0237f31b6b39bdb179c9e72aa025-pangeo/lib/python3.7/site-packages/holoviews/plotting/plot.py in _construct_callbacks(self)
    952         for source in self.link_sources:
    953             streams = [
--> 954                 s for src, streams in registry for s in streams
    955                 if src is source or (src._plot_id is not None and
    956                                      src._plot_id == source._plot_id)]

/home/conda/store/5413108540ec5590442f729933018374edec0237f31b6b39bdb179c9e72aa025-pangeo/lib/python3.7/site-packages/holoviews/plotting/plot.py in <listcomp>(.0)
    953             streams = [
    954                 s for src, streams in registry for s in streams
--> 955                 if src is source or (src._plot_id is not None and
    956                                      src._plot_id == source._plot_id)]
    957             cb_classes |= {(callbacks[type(stream)], stream) for stream in streams

AttributeError: 'Row' object has no attribute '_plot_id'
Column
    [0] Row
        [0] HoloViews(DynamicMap, widgets={'time': <class '...})
        [1] Column
            [0] WidgetBox
                [0] Select(margin=(20, 20, 20, 20), name='Time', options=OrderedDict([('2013-01-01 ...]), value=numpy.datetime64('2013-01-..., width=250)
            [1] VSpacer()
    [1] ParamFunction(function)

Am I doing this wrong or is it a bug?

When you set pn.widgets.Select, hvplot becomes a pn.Row object with the first item being a pn.pane.Holoviews and the second item as a pn.pane.Select. With the type changes in mind, this works:

  1. split hvplot call to save to two variables
  2. change source to point to image.object (the actual holoviews object, not panel)
  3. add select widget to column
import panel as pn
import numpy as np
import xarray as xr
import holoviews as hv
import hvplot.xarray

pn.extension()

ds = xr.tutorial.open_dataset('air_temperature')
image, select = ds.hvplot('lon', 'lat', widgets={'time':pn.widgets.Select})
stream = hv.streams.Tap(source=image.object, x=-88 + 360, y=40)

def timeseries(x, y):
    return ds.sel(lon=x, lat=y, method='nearest').hvplot('time')

pn.Column(image, select, pn.bind(timeseries, x=stream.param.x, y=stream.param.y))

If overlaying with anything, it doesn’t work either.

import panel as pn
import numpy as np
import xarray as xr
import holoviews as hv
import hvplot.xarray

pn.extension()

ds = xr.tutorial.open_dataset('air_temperature')
image, select = ds.hvplot('lon', 'lat', widgets={'time':pn.widgets.Select}, coastline=True)
stream = hv.streams.Tap(source=image.object, x=-88 + 360, y=40)

def timeseries(x, y):
    return ds.sel(lon=x, lat=y, method='nearest').hvplot('time')

pn.Column(image, select, pn.bind(timeseries, x=stream.param.x, y=stream.param.y))

The solution is to do image * gv.features.coastline() after calling the bind.

Adding to this discussion. I was trying to embed this into a dashboard. This is the working code:

ds = xr.tutorial.open_dataset('air_temperature')
#create a new variable to have something to change
ds['air_C'] = ds['air']-273

class GliderParams(param.Parameterized):
    '''Class containing the methods for dataset and variable selection'''
    
    surface_var = param.Selector(['air','air_C'], default = 'air', label = 'Surface Field')

    #@param.depends('surface_var')
def imaging(surface_var):
    image,select = ds[surface_var].hvplot(groupby='time',widget_location = 'bottom',
                                         cmap='RdBu_r',ylim=[15,80],xlim = [200,360],
                                          crs=ccrs.PlateCarree(),projection=ccrs.PlateCarree())
                                          #coastline=True,
                                        
    stream = hv.streams.Tap(source=image.object, x=0, y=0)
    timeseries = ds[surface_var].interactive.sel(lon=stream.param.x, lat=stream.param.y, method='nearest').hvplot('time') 
    return pn.Column(image, select,timeseries.dmap())

gp = GliderParams()
pn.Row(pn.Param(gp, name=''),pn.bind(imaging,gp.param.surface_var))

However, when adding coastline=True, I get an empty plot (not sure why).

The second problem I’m encountering is how to add a dynamic title to the timeseries plot to incorporate the clicked lat/lon?

Thank you!

The solution is to do image * gv.features.coastline() after calling the bind.

And maybe

timeseries = ds[surface_var].interactive.sel(lon=stream.param.x, lat=stream.param.y, method='nearest').hvplot('time').apply.opts(title=f"{stream.param.x}, {stream.param.y}")
  1. I assumed gv to be geoviews but then I get an error that geoviews has no “features”
  2. I tried this approach. If using “stream.param.x”, I just get “param.ClassSelector at …”. If using “stream.x”, no updates.
1 Like

Hi @khider

After reading your last comment I am in doubt if you need more help. Could you post your minimum, reproducible example and questions if any to make it very clear what you are looking for? Thanks. :+1:

Working Example:

#To load and manipulate the data

import xarray as xr
import os
import glob
import numpy as np
import math
import pandas as pd
from calendar import monthrange
import xesmf as xe
import dask

#For Viz
import matplotlib.pyplot as plt
import param
import datetime as dt
import panel as pn
import hvplot.xarray # noqa
import holoviews as hv
import panel.widgets as pnw
import cartopy.crs as ccrs
import geoviews as gv

ds = xr.tutorial.open_dataset('air_temperature')
#create a new variable to have something to change
ds['air_C'] = ds['air']-273

class GliderParams(param.Parameterized):
    '''Class containing the methods for dataset and variable selection'''
    
    surface_var = param.Selector(['air','air_C'], default = 'air', label = 'Surface Field')

    #@param.depends('surface_var')
def imaging(surface_var):
    image,select = ds[surface_var].hvplot(groupby='time',widget_location = 'bottom',
                                         cmap='RdBu_r',ylim=[15,80],xlim = [200,360],
                                          crs=ccrs.PlateCarree(),projection=ccrs.PlateCarree())
                                          #coastline=True,
                                        
    stream = hv.streams.Tap(source=image.object, x=0, y=0)
    timeseries = ds[surface_var].interactive.sel(lon=stream.param.x, lat=stream.param.y, method='nearest').hvplot('time')
    return pn.Column(image, select,timeseries.dmap())

gp = GliderParams()
pn.Row(pn.Param(gp, name=''),pn.bind(imaging,gp.param.surface_var))

To this, I’m trying to add two things:

  1. A title to the timeseries plot. I modified the imaging function to:
def imaging(surface_var):
    image,select = ds[surface_var].hvplot(groupby='time',widget_location = 'bottom',
                                         cmap='RdBu_r',ylim=[15,80],xlim = [200,360],
                                          crs=ccrs.PlateCarree(),projection=ccrs.PlateCarree())
                                          #coastline=True,
                                        
    stream = hv.streams.Tap(source=image.object, x=0, y=0)
    timeseries = ds[surface_var].interactive.sel(lon=stream.param.x, lat=stream.param.y, method='nearest').hvplot('time').apply.opts(title=f"{stream.x}, {stream.y}")
    return pn.Column(image, select,timeseries.dmap())

Which returns: 0,0 as the title (the default for stream) but doesn’t update.

  1. I’m trying to add coastlines. In my example, not sure how to do this after the bind so I tried the following:
def imaging(surface_var):
    image,select = ds[surface_var].hvplot(groupby='time',widget_location = 'bottom',
                                         cmap='RdBu_r',ylim=[15,80],xlim = [200,360],
                                          crs=ccrs.PlateCarree(),projection=ccrs.PlateCarree())
                                          #coastline=True,
                                        
    stream = hv.streams.Tap(source=image.object, x=0, y=0)
    timeseries = ds[surface_var].interactive.sel(lon=stream.param.x, lat=stream.param.y, method='nearest').hvplot('time').apply.opts(title=f"{stream.x}, {stream.y}")
    return pn.Column(image* gv.features.coastline(), select,timeseries.dmap())

And got:


AttributeError Traceback (most recent call last)
in
1 gp = GliderParams()
----> 2 pn.Row(pn.Param(gp, name=‘’),pn.bind(imaging,gp.param.surface_var))

/srv/conda/envs/notebook/lib/python3.8/site-packages/panel/layout/base.py in init(self, *objects, **params)
359 "as positional arguments or as a keyword, "
360 “not both.” % type(self).name)
→ 361 params[‘objects’] = [panel(pane) for pane in objects]
362 elif ‘objects’ in params:
363 params[‘objects’] = [panel(pane) for pane in params[‘objects’]]

/srv/conda/envs/notebook/lib/python3.8/site-packages/panel/layout/base.py in (.0)
359 "as positional arguments or as a keyword, "
360 “not both.” % type(self).name)
→ 361 params[‘objects’] = [panel(pane) for pane in objects]
362 elif ‘objects’ in params:
363 params[‘objects’] = [panel(pane) for pane in params[‘objects’]]

/srv/conda/envs/notebook/lib/python3.8/site-packages/panel/pane/base.py in panel(obj, **kwargs)
49 if kwargs.get(‘name’, False) is None:
50 kwargs.pop(‘name’)
—> 51 pane = PaneBase.get_pane_type(obj, **kwargs)(obj, **kwargs)
52 if len(pane.layout) == 1 and pane._unpack:
53 return pane.layout[0]

/srv/conda/envs/notebook/lib/python3.8/site-packages/panel/param.py in init(self, object, **params)
687 if object is not None:
688 self._validate_object()
→ 689 self._replace_pane(not self.lazy)
690
691 @param.depends(‘object’, watch=True)

/srv/conda/envs/notebook/lib/python3.8/site-packages/panel/param.py in _replace_pane(self, force, *args)
730 new_object = Spacer()
731 else:
→ 732 new_object = self.eval(self.object)
733 self._update_inner(new_object)
734 finally:

/srv/conda/envs/notebook/lib/python3.8/site-packages/panel/param.py in eval(self, function)
720 args = (getattr(dep.owner, dep.name) for dep in arg_deps)
721 kwargs = {n: getattr(dep.owner, dep.name) for n, dep in kw_deps.items()}
→ 722 return function(*args, **kwargs)
723
724 def _replace_pane(self, *args, force=False):

/srv/conda/envs/notebook/lib/python3.8/site-packages/param/parameterized.py in _depends(*args, **kw)
349 @wraps(func)
350 def _depends(*args,**kw):
→ 351 return func(*args,**kw)
352
353 deps = list(dependencies)+list(kw.values())

/srv/conda/envs/notebook/lib/python3.8/site-packages/panel/depends.py in wrapped(*wargs, **wkwargs)
171 combined_kwargs[kw] = arg
172
→ 173 return function(*combined_args, **combined_kwargs)
174 return wrapped

in imaging(surface_var)
17 stream = hv.streams.Tap(source=image.object, x=0, y=0)
18 timeseries = ds[surface_var].interactive.sel(lon=stream.param.x, lat=stream.param.y, method=‘nearest’).hvplot(‘time’).apply.opts(title=f"{stream.x}, {stream.y}")
—> 19 return pn.Column(image* gv.features.coastline(), select,timeseries.dmap())

AttributeError: module ‘geoviews’ has no attribute ‘features’
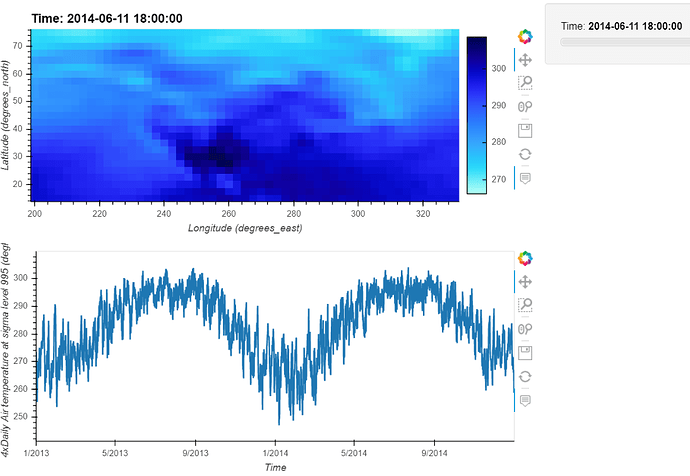
1 Like

gv.feature.coastline()
https://geoviews.org/user_guide/Geometries.html

Maybe don’t use interactive since it’s still new. Use the basic .param.watch or depends (see Holoviews to HoloViews — pYdeas 0.0.0 documentation)

1 Like

Thanks, that actually solved a lot of my problems.

2 Likes

How would I wrap the

gv.tile_sources.CartoDark() * gv.Points([-122.76, 49.555]).opts(alpha=0)

in order to make it responsive (sizing_mode="stretch_width") as it seems if I wrap in pn.pane.Holoviews I get the
AttributeError: 'HoloViews' object has no attribute '_plot_id'

class Example(pn.viewable.Viewer):
    def get_map(self):
        return (gv.tile_sources.CartoDark() * gv.Points([-122.76, 49.555]).opts(alpha=0)).opts(width=1000)

    def tap_series(self, x, y):
        lon, lat = to_lon_lat(x, y)
        self.figs_col.clear()
        self.figs_col.append( lon )
        return hv.Div(
            """<hr style="border-top: 1px transparent; height: 1px;">"""
        ).opts(height=5)

    def __init__(self):
        self.figs_col = pn.Column()
        self.map = self.get_map()
        self.tap_stream = hv.streams.Tap(source=self.map, x=-122.76, y=49.555)
        self.dynamic_map = hv.DynamicMap(self.tap_series, streams=[self.tap_stream])
        super().__init__()

    def view(self):
        return pn.Column(self.dynamic_map, self.figs_col)


app = Example()

template = pn.template.MaterialTemplate(
    logo="https://www.canada.ca/etc/designs/canada/wet-boew/assets/sig-blk-en.svg",
    site="CMC",
    title="Temperatures for different models",
    main=[app.map, app.view],
    sidebar_width=200,
).servable()

Hi @StuckDuckF

Please open a new post with a minimum, reproducible example. You are welcome to refer to the old post.

  • It will help the responder to quickly understand the issue without having to read through lots and lots of context.
  • It will help the community find posts and answers+responses that are possible to digest relatively quickly.

Thanks.