I’d like to suggest adding hvplot parameter to skip missing data on the x axis.
E.g. OHLC charts create gap for missing day “2022-08-02”:
import hvplot.pandas
import pandas as pd

data = pd.DataFrame(
    {
        "Open": [100.00, 101.25, 102.75],
        "High": [104.10, 105.50, 110.00],
        "Low": [94.00, 97.10, 99.20],
        "Close": [101.15, 99.70, 109.50],
        "Volume": [10012, 5000, 18000],
    },
    index=[
        pd.Timestamp("2022-08-01"),
        pd.Timestamp("2022-08-03"),
        pd.Timestamp("2022-08-04"),
    ],
)

df = pd.DataFrame(data)

ohlc = df.hvplot.ohlc(width=300, height=200)
ohlc
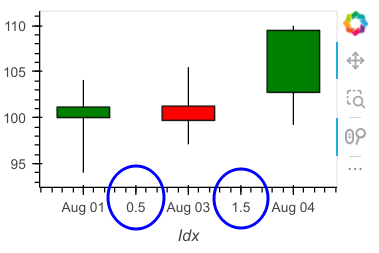
I found work-around, but there is too much work, to fix x-axis, but in some cases, the numbers occurs in the x-axis labels:
df = df.reset_index(names="Date")
df["Idx"] = pd.RangeIndex(0, df.shape[0], 1)

ohlc = df.hvplot.ohlc(
    x="Idx", y=["Open", "High", "Low", "Close"], width=300, height=200
)

# fix x tick labels ------
import holoviews as hv
from bokeh.io import show

fig = hv.render(ohlc)
fig.xaxis.major_label_overrides = {
    i: dt.strftime("%b %d") for i, dt in enumerate(df["Date"])
}
# fix x tick labels ------

show(fig)
Could there be a parameter called eg skip_missing_data to take care of this? And I would call just:
df.ohlc(skip_missing_data=True)