Hello everyone,
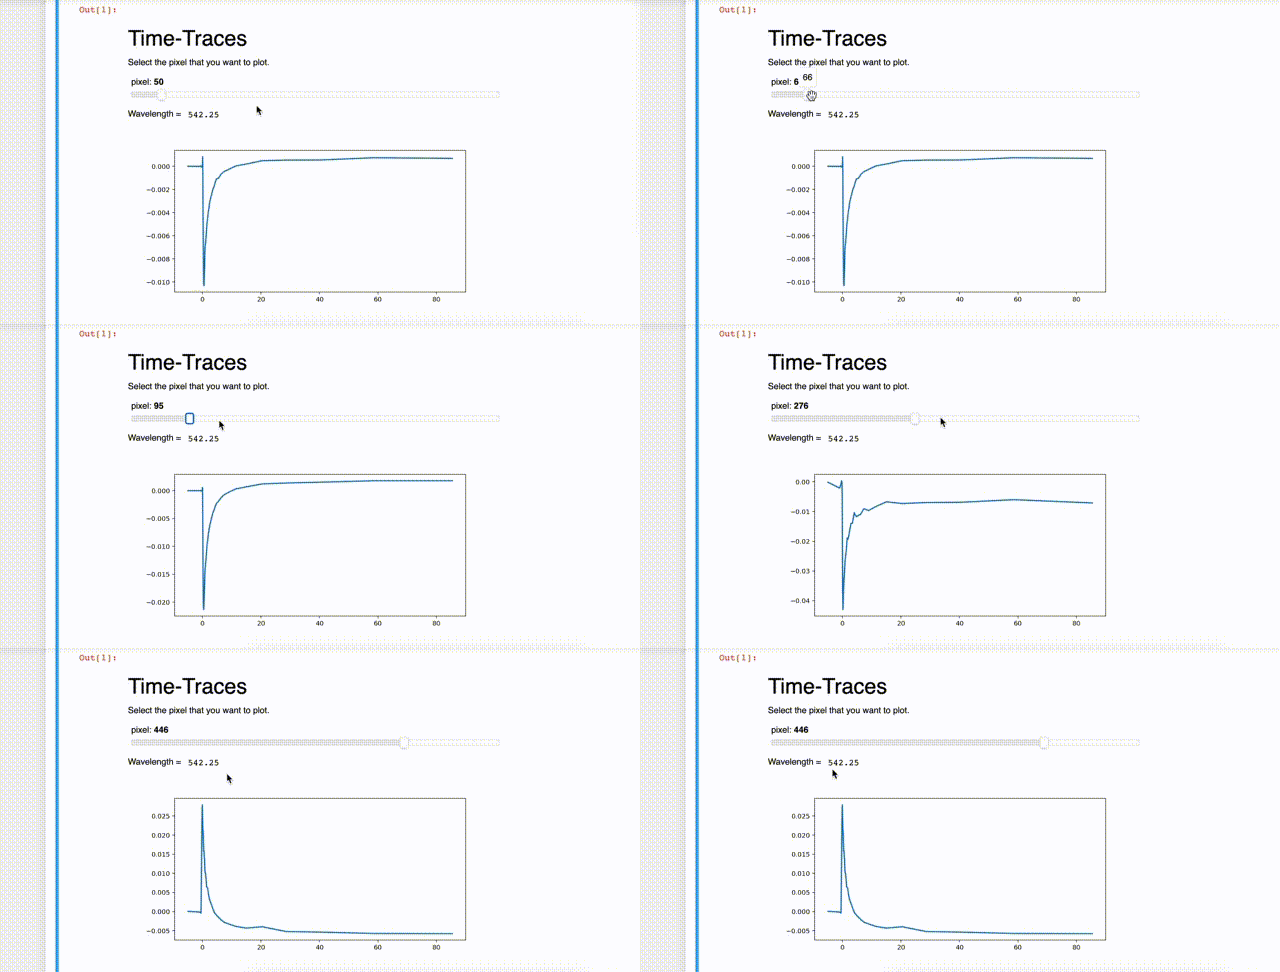
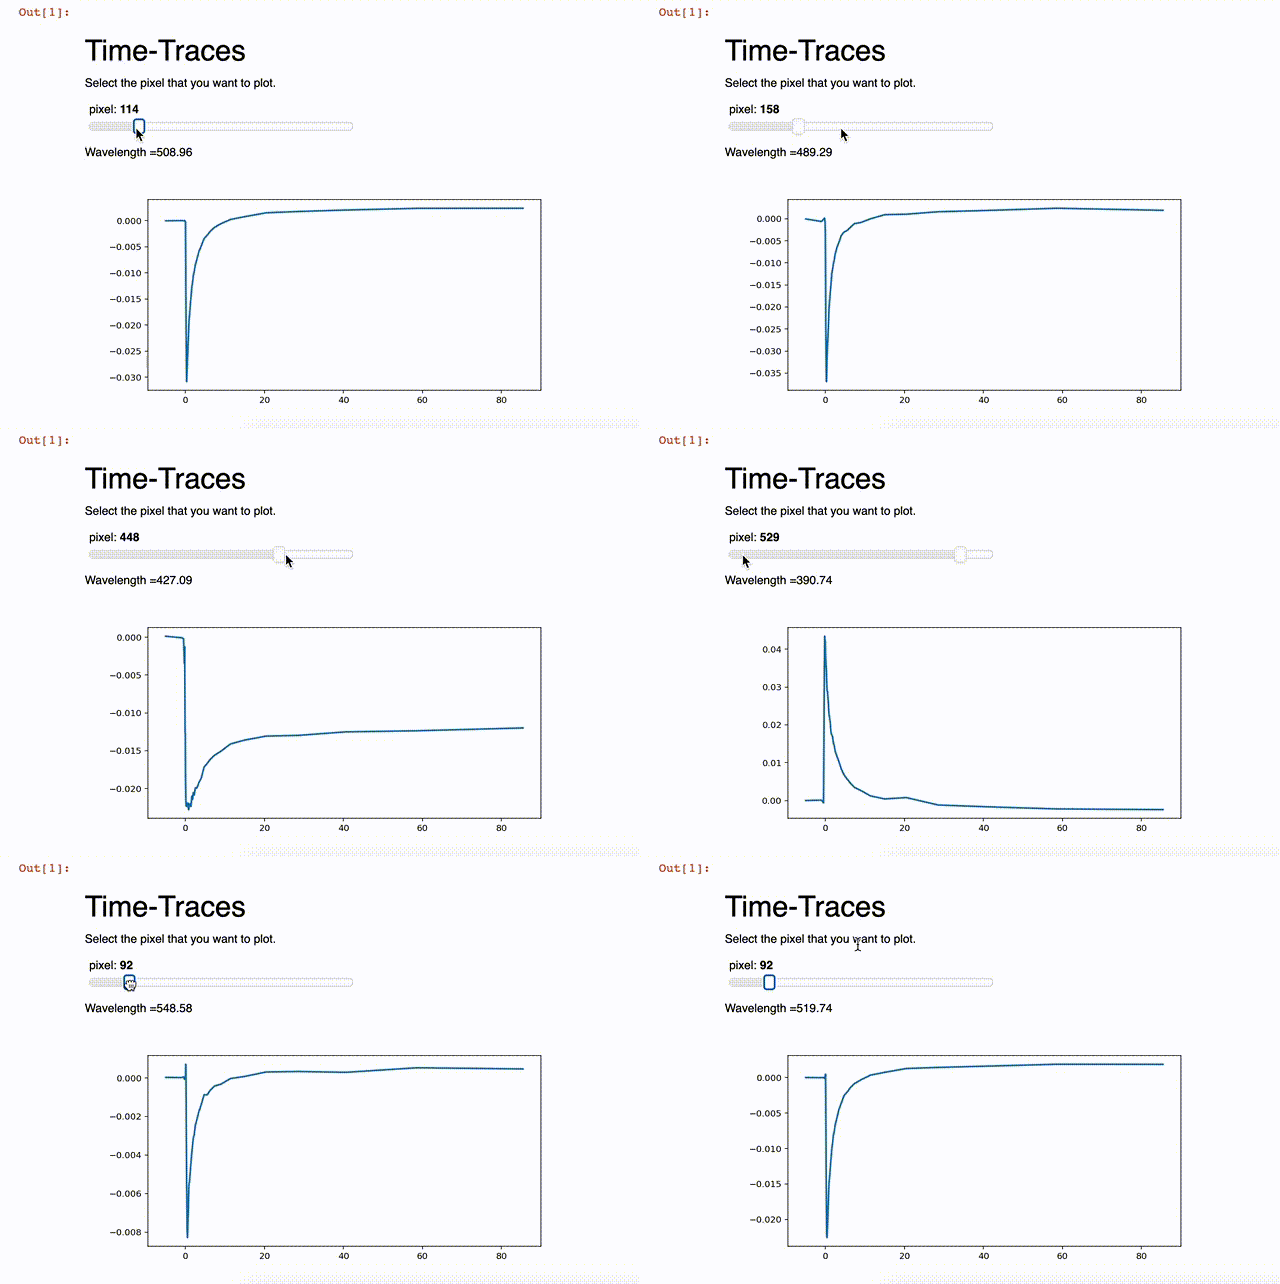
First of all, thanks for this great app. I started building my own data analysis tool with Panel. My question is as in the title. I want to do something very simple. I have a slider for a figure. It is an input parameter, pixel, just slicing (or indexing) my 2-dimensional array for single plots. However, every pixel value (arbitrary) corresponds to a wavelength value which lies in the first row of my data. I want that slider “pixel” also represent and update that wavelength value on dashboard next to the figure. I tried using i[0][0].value to get the value of the pixel slider, and calculate wavelength but function is not catching the value when I move the slider. How can I achieve this?

Any idea or direction would be highly appreciated! Thanks! 
Here is the code that I am working on.
import pandas as pd
import numpy as np
import panel as pn
import matplotlib.pyplot as plt
from matplotlib.figure import Figure
from matplotlib.backends.backend_agg import FigureCanvas

#Global Variables
fig_width = 8
fig_height = 4

%matplotlib inline
%matplotlib notebook

d = np.genfromtxt('visdata.dat', delimiter='\t')

def plot_timtrace(pixel=50):
    fig = Figure(figsize=(fig_width, fig_height))
    ax = fig.subplots()
    x1=(d[7:50,0]) #slicing first column of data as x-axis (which is time)
    y1=(d[7:50,pixel]) #slicing second column of data as y-axis (which is 1st pixel..)
    ax.plot(x1, y1, linewidth=2.0)
    return fig

import panel as pn
pn.extension()

pn.interact(plot_timtrace)

kw = dict(pixel=(1, (d.shape[1])-1))
i = pn.interact(plot_timtrace, **kw)

text = "<br>\n#Time-Traces\nSelect the pixel that you want to plot."

def find_wl():
    wl = d[0,i[0][0].value]
    return(wl)

wavelen_text = pn.interact(find_wl)

p = pn.Column(pn.Row(text) ,i[0][0], pn.Row("Wavelength =", wavelen_text), i[1][0])
p
