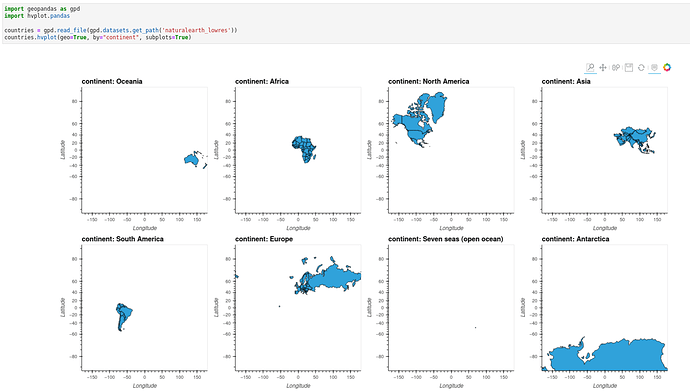
I was hoping to be able to create small multiples using the keyword “by” (as described for scatter plots in python - Create a grid of plots with holoviews/hvplot and set the max number of columns - Stack Overflow)
nz.hvplot(by='Island', subplots=True)
Unfortunately, this fails with
File d:\mambaforge\envs\geocompy\lib\site-packages\holoviews\core\dimension.py:989, in Dimensioned.get_dimension(self, dimension, default, strict)
    987 name_map.update({util.dimension_sanitizer(dim.name): dim for dim in all_dims})
    988 if strict and dimension not in name_map:
--> 989     raise KeyError("Dimension %r not found." % dimension)
    990 else:
    991     return name_map.get(dimension, default)

KeyError: "Dimension 'Longitude' not found."
One workaround I’ve found is to create a Layout from a list of plots created like this instead:
Layout([group.hvplot(title=name) for name, group in nz.groupby('Island')])
But this feels much less intuitive.
Is there something I’m doing wrong when using “by”?
Full code:
