Hello!
I have around 40k geo polygons I am trying to plot interactively. The idea being, users can click on any to select them, once they zoom in enough, or have an on-hover to show information.
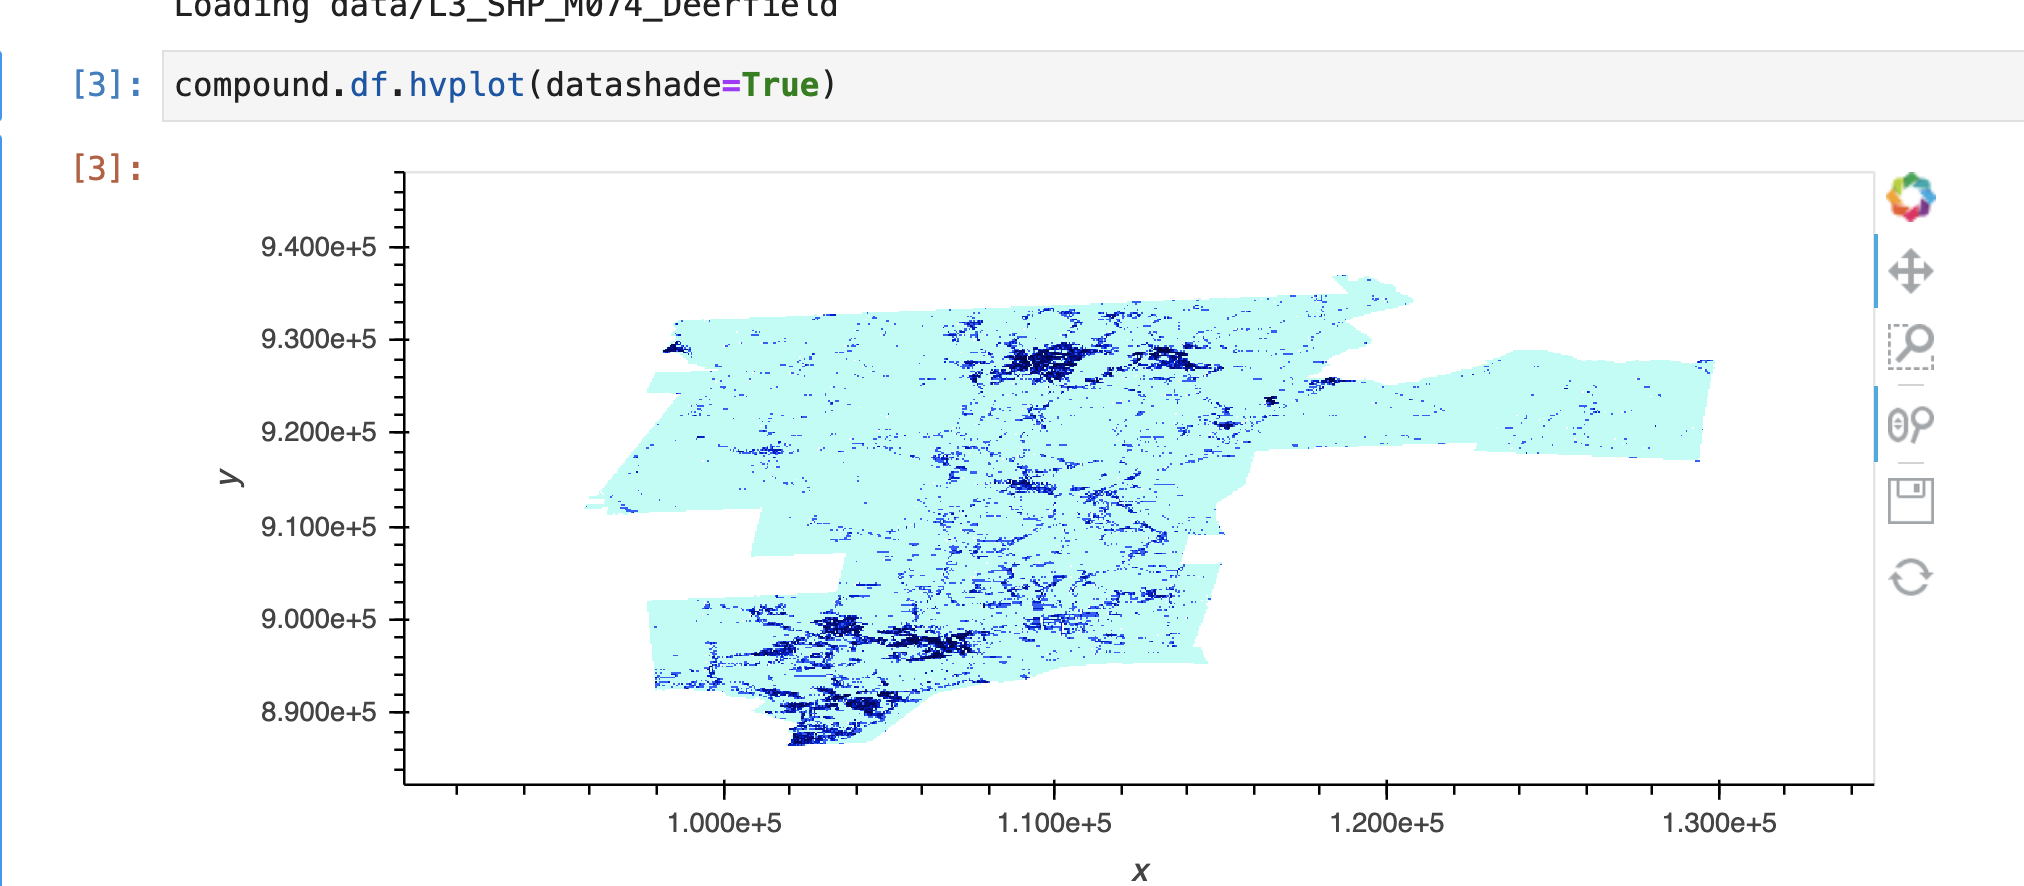
Without datashading, this seems to be rather slow. So I am trying to use the datashade with a spatialpandas dataframe.
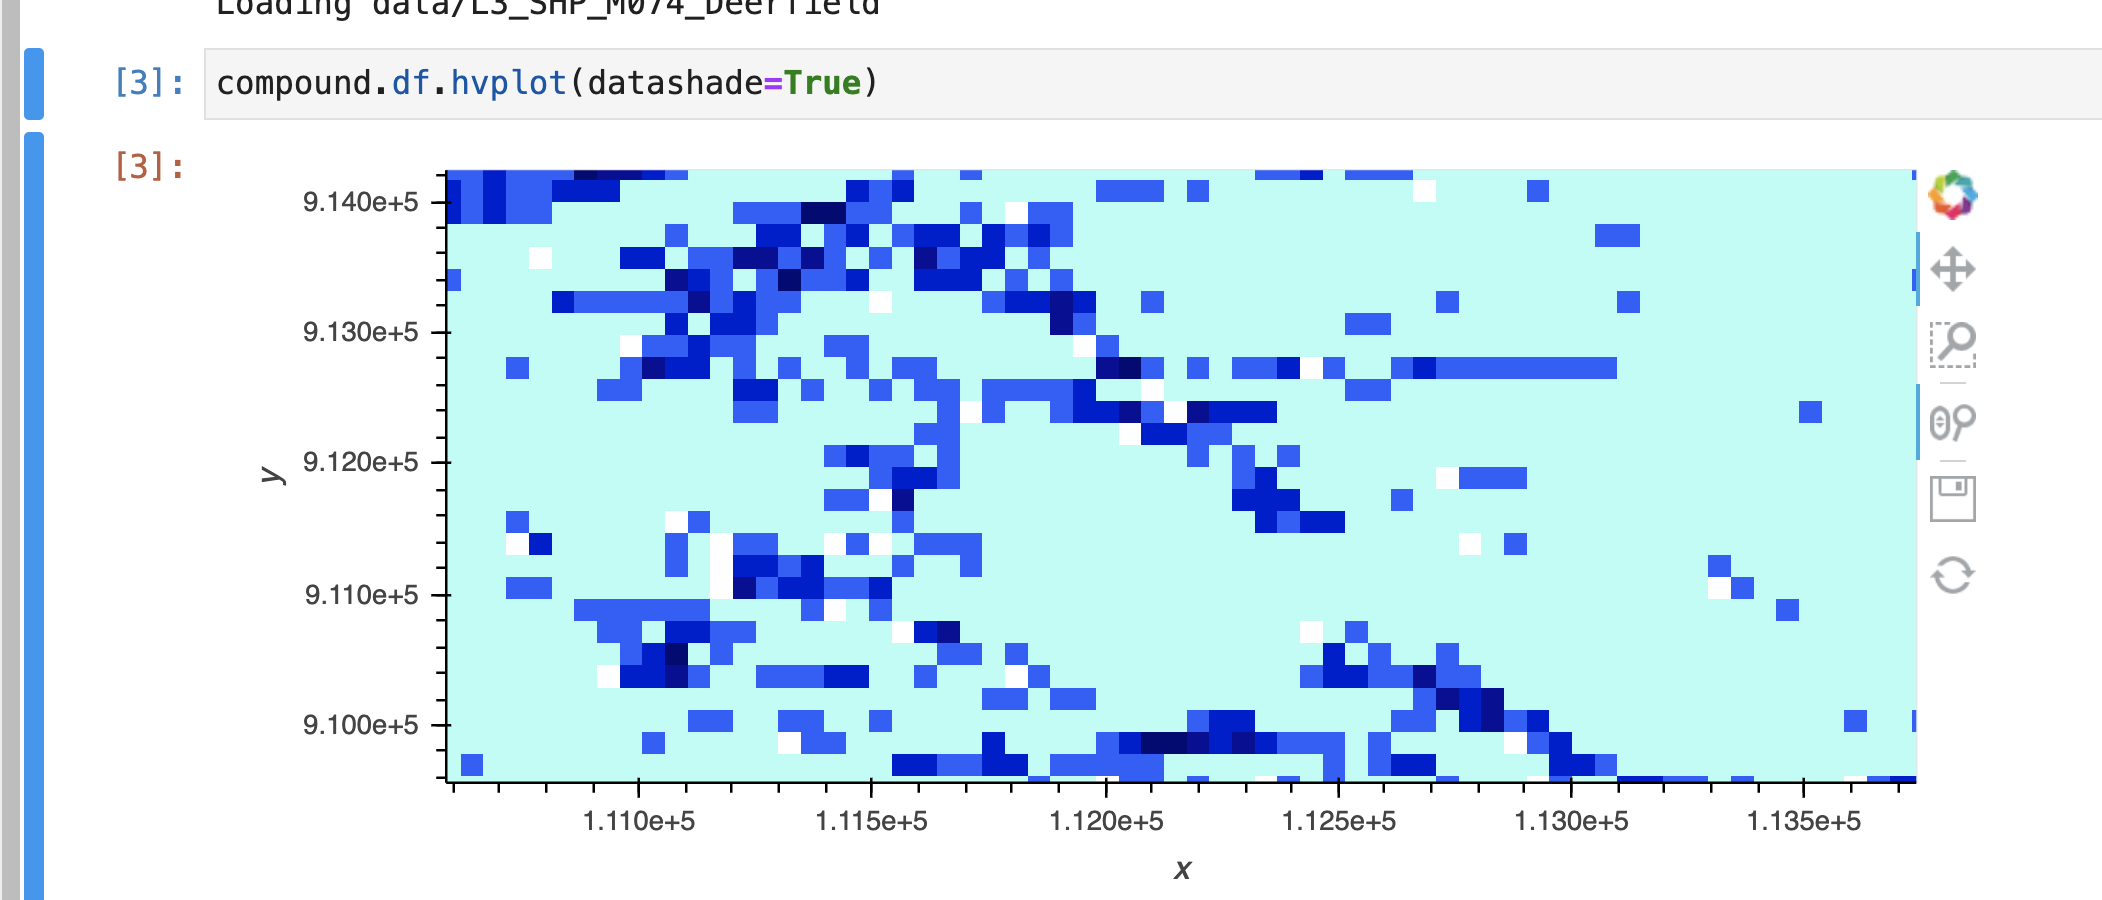
I am able to plot it with df.hvplot(datashade=True). However, when I zoom in, the pixels don’t seem to reload?
Thanks all!