Speed for plotting / relabeling points

I have ~10k points on a map, and I want to be able to select a subset, and change a label on them (e.g. a territory assignment) and then have the map update to reflect those changes (on a button press, for instance).

I tried using dynamic maps and a parameterized dict to store the territory assignments. It mostly works, but it is very, very slow to update, and sometimes the button push just fails to fire (maybe the previous events weren’t complete?). I suspect my issue relates to the fact that I am altering a pandas dataframe and re-loading all the points from there… it would probably be faster to alter the gv.Points set in-place?

Anyone have time to tinker with this example and make suggestions?

import geopandas as gpd
import pandas as pd

import geoviews as gv
import holoviews as hv
import panel as pn
from cartopy import crs
from holoviews.streams import param
from shapely.geometry import Point
import random

gv.extension('bokeh')
hv.renderer('bokeh').webgl = True

#records to generate
n = 10000

#bounding box
min_lng = -125
max_lng = -115
min_lat = 32
max_lat = 42

#generate 10,000 points in a bounding box
records = []
for point_id in range(0,n):
    records.append({'Point_Id':point_id,
                        'longitude':random.uniform(min_lng,max_lng),
                        'latitude':random.uniform(min_lat,max_lat)})

test_df = pd.DataFrame.from_records(records)

#split into sample sets; we want to be able to label points in any combination of model/flag independently
df_list = []
model_sets = ['Model 1','Model 2',]
flag_sets = ['True','False']
for m in model_sets:
    for f in flag_sets:
        temp_df = test_df.copy()
        temp_df.loc[:,'model'] = m
        temp_df.loc[:,'current_terr'] = 'Default'
        temp_df.loc[:,'Flag'] = f
        df_list.append(temp_df)

permutation_df = pd.concat(df_list,sort=False)

#convert to geodataframe
permutation_df.loc[:,'geom'] = permutation_df.apply(lambda r:Point(r['longitude'],r['latitude']),axis=1)
test_gdf = gpd.GeoDataFrame(data=permutation_df,crs='EPSG:4326',geometry = permutation_df['geom'] )
test_gdf.to_crs('EPSG:3857',inplace=True)
del test_gdf['geom']

#Widgets
model_pick = pn.widgets.Select(options=model_sets,
                                        name='Model',
                                        value=model_sets[0],
                                        width=250,
                                        disabled=False)
flag_pick = pn.widgets.Select(options=flag_sets,
                                        name='Flag',
                                        value=flag_sets[0],
                                        width=250,
                                        disabled=False)

text_input = pn.widgets.TextInput(name='Point Label', placeholder='Reviewed')

# button to push relabeling event
remap_points_button = pn.widgets.Button(name='Relabel Points', button_type='primary')
remap_points_button.on_click(callback = lambda event: push_point_updates(event=event,
                                                                    index=point_sel.index,
                                                                    table=plot_points,
                                                                    model=model_pick.value,
                                                                    flag=flag_pick.value,
                                                                    new_label=text_input.value))

class TerrMapper(param.Parameterized):
    '''
    stores map of point (including model & flag context) to label
    '''
    terr_map = param.Dict(doc = 'mapping dictionary for points-->territories, by context')

#instance with defaults
terr_map = test_gdf.groupby(['Point_Id','model','Flag']).agg({'current_terr':lambda x:list(x)[0]}).to_dict()['current_terr']    
terr_mapper = TerrMapper(terr_map=terr_map)

@pn.depends(terr_map=terr_mapper.param.terr_map,watch=True)
def base_point_func(terr_map):
    '''
    build the base point object with territory labels from the terr_map dict
    '''
    # map the 'new_terr' column based on current state of the terr_map dict (this may be the slow part; how can we label in-place on the points objects rather than re-drawing them all?)
    test_gdf.loc[:,'new_terr'] = test_gdf.apply(lambda x:terr_map[(x['Point_Id'],x['model'],x['Flag'])],axis=1)
    base_points = gv.Points(data=test_gdf,vdims=['Point_Id','new_terr','model','Flag'],crs=crs.GOOGLE_MERCATOR)
    return base_points.opts(height=800,width=1000,color='new_terr',cmap='glasbey',show_legend=True)

def dyn_points(base_points,model,flag):
    '''
    subset of points to be visible based on picklist choices
    '''
    model_points = base_points.select(model=model,Flag=flag)
    return model_points

base_points = hv.DynamicMap(base_point_func,streams=dict(terr_map=terr_mapper.param.terr_map))
plot_points = base_points.apply(dyn_points,model=model_pick.param.value,flag=flag_pick.param.value)
point_sel = hv.streams.Selection1D(source=plot_points)

@pn.depends(index=point_sel.param.index)
def sel_table(index):
    '''
    for inspecting selected point values metadata
    '''
    filtered_table = plot_points[()].data.iloc[index,:]
    out_cols = [c for c in filtered_table.columns if c!='geometry']
    #not_nulls = filtered_table[()].data.iloc[index,:]
    return hv.Table(filtered_table[out_cols])

def push_point_updates(event,index,table,model,flag,new_label):
    '''
    update terr_map with new territory labels for selected points
    '''
    Point_Id_list = list(table[()].data.iloc[index]['Point_Id'].values[:])
    temp_dict = terr_mapper.terr_map.copy()
    for Point_Id in Point_Id_list:
        temp_dict[(Point_Id,model,flag)] = new_label
        
    terr_mapper.param.set_param(terr_map=temp_dict)
    base_points.event(terr_map=temp_dict)

#Plots
hv_table = hv.DynamicMap(sel_table)
pn_test = gv.tile_sources.OSM() * plot_points.opts(tools=['lasso_select'])

layout = pn.Column(pn.Row(model_pick,flag_pick,remap_points_button,text_input),pn.Row(pn_test,hv_table))
layout

example of UI after a re-labelling event:
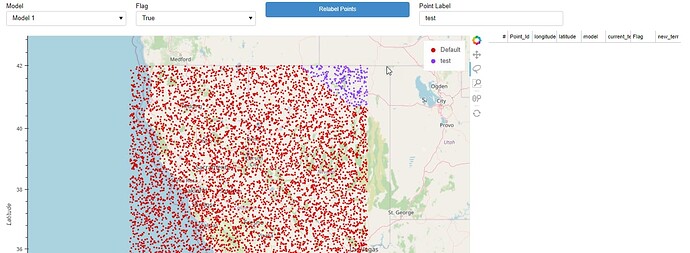
Slightly faster and a lot more reliable by parameterizing the geodataframe, but I’d still be interested to hear from others if I am doing something silly here in terms of performance/optimization.

Latest version with the geodataframe as a parameter and the base points as a dynamic map from there:


import geopandas as gpd
import pandas as pd
import geoviews as gv
import holoviews as hv
import panel as pn
from cartopy import crs
from holoviews.streams import param
from shapely.geometry import Point
import random
from colorcet import glasbey

gv.extension('bokeh')
hv.renderer('bokeh').webgl = True


#records to generate
n = 10000

#bounding box
min_lng = -125
max_lng = -115
min_lat = 32
max_lat = 42

#generate 10,000 points in a bounding box
records = []
for point_id in range(0,n):
    records.append({'Point_Id':point_id,
                        'longitude':random.uniform(min_lng,max_lng),
                        'latitude':random.uniform(min_lat,max_lat)})

test_df = pd.DataFrame.from_records(records)


#split into sample sets; we want to be able to label points in any combination of model/flag independently
df_list = []
model_sets = ['Model 1','Model 2',]
flag_sets = ['True','False']
for m in model_sets:
    for f in flag_sets:
        temp_df = test_df.copy()
        temp_df.loc[:,'model'] = m
        temp_df.loc[:,'current_terr'] = 'Default'
        temp_df.loc[:,'Flag'] = f
        df_list.append(temp_df)

permutation_df = pd.concat(df_list,sort=False)


#convert to geodataframe
permutation_df.loc[:,'geom'] = permutation_df.apply(lambda r:Point(r['longitude'],r['latitude']),axis=1)
test_gdf = gpd.GeoDataFrame(data=permutation_df,crs='EPSG:4326',geometry = permutation_df['geom'] )
test_gdf.to_crs('EPSG:3857',inplace=True)
del test_gdf['geom']


#Widgets
model_pick = pn.widgets.Select(options=model_sets,
                                        name='Model',
                                        value=model_sets[0],
                                        width=250,
                                        disabled=False)
flag_pick = pn.widgets.Select(options=flag_sets,
                                        name='Flag',
                                        value=flag_sets[0],
                                        width=250,
                                        disabled=False)

text_input = pn.widgets.TextInput(name='Point Label', placeholder='Reviewed')

# button to push relabeling event
remap_points_button = pn.widgets.Button(name='Relabel Points', button_type='primary')
remap_points_button.on_click(callback = lambda event: push_point_updates(event=event,
                                                                    index=point_sel.index,
                                                                    table=plot_points,
                                                                    model=model_pick.value,
                                                                    flag=flag_pick.value,
                                                                    new_label=text_input.value))


class TerrMapper(param.Parameterized):
    df = param.DataFrame(precedence=-1) # precedence <1, will not be shown as widget
    color_map_labels = param.Dict(default={'Default':glasbey[0]})
#instance with defaults
terr_map = test_gdf.groupby(['Point_Id','model','Flag']).agg({'current_terr':lambda x:list(x)[0]}).to_dict()['current_terr']    
base_df = TerrMapper(df=test_gdf)


test_gdf.loc[:,'new_terr'] = test_gdf.loc[:,'current_terr']

@pn.depends(df=base_df.param.df,color_map=base_df.param.color_map_labels)
def base_point_func(df,color_map):
    return gv.Points(data=df,vdims=['Point_Id','new_terr','model','Flag'],crs=crs.GOOGLE_MERCATOR).opts(height=800,width=1000,color='new_terr',cmap=color_map,show_legend=True)


def dyn_points(base_points,model,flag):
    '''
    subset of points to be visible based on picklist choices
    '''
    model_points = base_points.select(model=model,Flag=flag)
    return model_points

base_points = hv.DynamicMap(base_point_func)
plot_points = base_points.apply(dyn_points,model=model_pick.param.value,flag=flag_pick.param.value)
point_sel = hv.streams.Selection1D(source=plot_points)

@pn.depends(index=point_sel.param.index)
def sel_table(index):
    '''
    for inspecting selected point values metadata
    '''
    filtered_table = plot_points[()].data.iloc[index,:]
    out_cols = [c for c in filtered_table.columns if c!='geometry']
    #not_nulls = filtered_table[()].data.iloc[index,:]
    return hv.Table(filtered_table[out_cols])

def push_point_updates(event,index,table,model,flag,new_label):
    '''
    update terr_map with new territory labels for selected points
    '''
    if new_label not in base_df.color_map_labels:
        current_size = len(base_df.color_map_labels.keys())
        base_df.color_map_labels[new_label] = glasbey[current_size+1]
    base_df.df.loc[index,'new_terr'] = new_label
    
    base_points.event(df=base_df.df,color_map=base_df.color_map_labels)

#Plots
hv_table = hv.DynamicMap(sel_table)
pn_test = gv.tile_sources.OSM() * plot_points.opts(tools=['lasso_select'])

pn.Column(pn.Row(model_pick,flag_pick,remap_points_button,text_input),pn.Row(pn_test,hv_table))


Hi @sbi_vm,

This is maybe a bit complex for myself without really digging it apart and building ground up to understand what is going on fully.

Anyway I have been having a play with this, it seems though mentioned there is 10000 records looking into the dataframes there is 40k records for processing if I’m looking at it correctly, I guess setting n=2500 would give you indication of performance around 10000 records (even though it’s not in terms of points on graph). I don’t know how to handle the information better but with the button and table I would activate the loading spinner so you have indication it is still processing.

Thanks, Carl.

Thank you @carl ,

Completely correct, full simulated set is 40k, with only 1/4 visible on the screen as a working set at a time (via gv.Points dynamic map from a .select() filter on the full point set). I guess I am also trying to benchmark expectations here; is holoviews/geoviews expected to be able to handle smooth interactions with 1k points? 10k points? 100k points? 1M? Is bokeh the bottleneck? Is Javascript/browser the bottleneck?

I am trying to approximate postal/zip codes with this, where that’s roughly the volume I’ll have to handle. Might have to branch out to a different solution/framework if this one is just not aligned with that volume.

I like your suggestion of a visual indicator if further performance improvements aren’t possible. I’ve tried to get a loading spinner going in panel/holoviews several times and have never had success; maybe I’ll post that as a separate topic.

Thank you for your time!

Hi @sbi_vm,

If you double n so you have 20k, now you will likely see the connection gets shut down error message. So yes you have hit some kind of bottleneck, what is the neck, I would say browser limitiations, bokeh works within these limitations well actually the user can stretch them and there are other bits you can do with the server connection to massage the limitiations but you will still quite quickly rehit especially with your project by the sounds of it…

Butbut the beauty of the pyviz ecosystem is that it is built somewhat on top of bokeh and brings a wealth of features to assist you in populating the graph with even more points than the limitations your going to hit. How can this be, simply from my understanding and I’m no doubt simplyfying some really hard work here but the tools like datashader and holoviews rasterize is that it turns your data into an image (far less taxing for the web browser) and displays it on screen as one instead of the individual glyphs and is still very much interactive with the bokeh graph tools and somewhat the end user experience is none the wiser they just have an image graph presented to zoom around in. Maybe see here https://holoviews.org/user_guide/Large_Data.html I noted a point at the bottom that will likely be important to you at some point with working with the geoviews.

I think you’ll find the above tools of great use here

Thanks carl,

Sounds like I’m not just missing something basic and it is a limit with my current approach.

Yeah I am really enjoying the pyviz ecosystem for this stuff, and I definitely think there are design options to side-step this issue. For instance, instead of using each point as an “entity” to select, I could instead do some kind of polygon draw over a rasterized image, and then have some back-end geopandas stuff figure out what points are within that polygon, even if they weren’t all represented on the front end javascript in browser… just trying to wrap my head around “next steps” in my design decision tree. Definitely need to do a deep dive into the datashader stuff to figure out what’s “built in” vs what I have to do on back end.

Thank you for your feedback / attention on this one!