I have a sublcass of pn.viewable.Viewer that generates a Bokeh plot. I would like to include this plot into a sphinx documentation page, so I’ve tried the bokeh-plot sphinx extension.
This is a docstring example.
.. bokeh-plot::
    :source-position: above

    from bokeh.plotting import figure, show
    from bokeh.models import Patch, ColumnDataSource
    import panel as pn

    class Asd(pn.viewable.Viewer):
        def __init__(self, **params):
            super().__init__(**params)
            self._create_fig()

        def _create_fig(self):
            self.fig = figure(width=500, height=250)
            x = [0, 2, 2, 0]
            y = [0, 0, 2, 2]
            source = ColumnDataSource({"x": x, "y": y})
            self.fig.line("x", "y", source=source, line_width=2)

        def __panel__(self):
            return pn.pane.Bokeh(self.fig)

    show(Asd().fig)
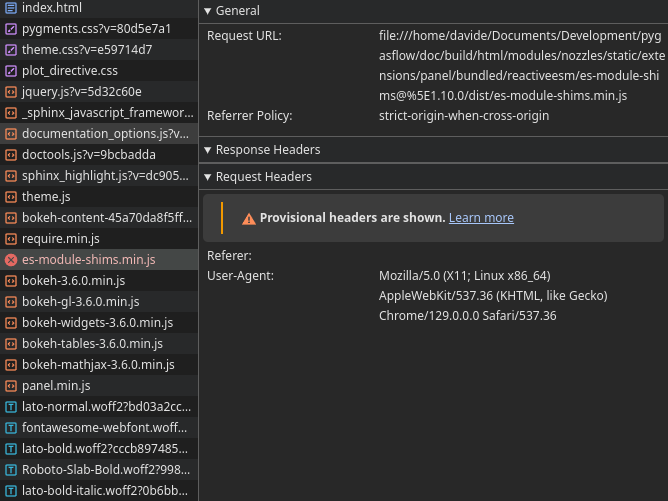
The documentation is built without errors. However, the browser in unable to load the plot. Here is a screenshot of the browser inspector, showing that es-module-shims.min.js is missing. Looking at the request url, it appears to be a file related to panel.
My guess is that panel and bokeh-plot don’t really work well together. Is there any other way I could show my Bokeh figure?
