tupui
October 13, 2023, 4:12pm
1
Anyone has a recipe to produce stacked histograms?
If I try the following
df.hvplot.hist(stacked=True, color=colors_hex)
I get:
WARNING:param.main: Stacking for histograms is not yet implemented in holoviews. Use bar plots if stacking is required.
My dataframe is a simple 9 columns by 3k rows and I want to get something like this:
This is the output from seaborn with:
ax = sns.histplot(
    df,
    multiple="stack",
    stat="probability",
    palette= colors_hex,
    common_bins=True,
    common_norm=True,
    bins=n_bins,
    legend=False,
    ax=ax,
)
1 Like
Hoxbro
October 13, 2023, 8:11pm
2
To be honest, I don’t think the functionality is there in HoloViews (yet!). There is this feature request . We can go down into pure Bokeh with Hooks and do something like this:
import hvplot.pandas # noqa: F401
import numpy as np
import pandas as pd
import panel as pn
def stacked_hist(plot, element):
offset = 0
for r in plot.handles["plot"].renderers:
r.glyph.bottom = "bottom"
data = r.data_source.data
new_offset = data["top"] + offset
data["top"] = new_offset
data["bottom"] = offset * np.ones_like(data["top"])
offset = new_offset
plot.handles["plot"].y_range.end = max(offset) * 1.1
plot.handles["plot"].y_range.reset_end = max(offset) * 1.1
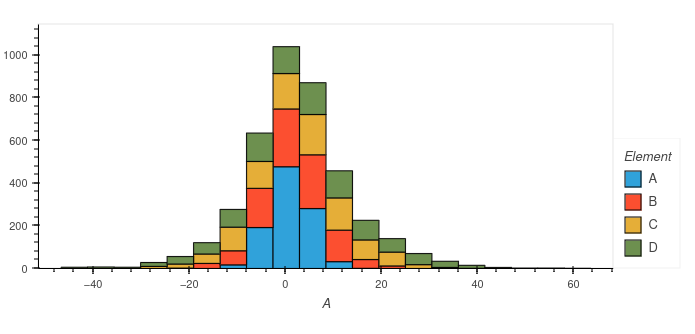
df = pd.DataFrame(
np.random.normal(1, 4, (1000, 4)) * np.arange(1, 5), columns=list("ABCD")
)
plot = df.hvplot.hist().opts(hooks=[stacked_hist]) + df.hvplot.hist()
pn.panel(plot).servable()
Note as it is a bit late, a mistake could have sneaked in when making the code, but the fundamentals should be there.
2 Likes
tupui
October 14, 2023, 12:12pm
3
Oh waou thank you so much! I will try to use that and let you know if I have issues.
For a bit more context, I am working on a panel app which right now is using seaborn. And I am trying to see how I can convert these so that the figures can be interactive.
1 Like