Dear holoviews developers and community,
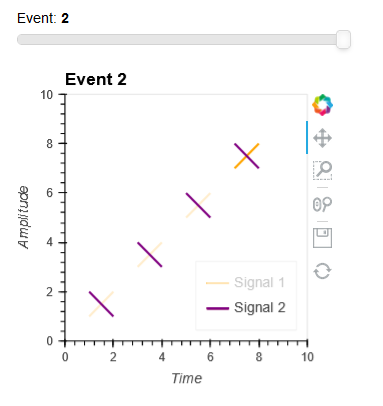
thanks a lot for this awesome package. I have a question regarding legends of similarly labeled plots within an overlay using a stream in a DynamicMap. I noticed that the legend breaks if the number of plotted object changes. E.g. I have two type of signals where the number of signals can change per event. Please also see the following MWE and attached images.
#Define some dummy data with different number of signals per event:
x_test_data_1 = [[[1,2], [3, 4], [5, 6]], event 1
[[1,2], [3, 4]], event 2
[[1,2], [3, 4], [5, 6], [7, 8]], event 3
]
y_test_data_1 = [[[1,2], [3, 4], [5, 6]], event 1
[[1,2], [3, 4]], event 2
[[1,2], [3, 4], [5, 6], [7, 8]] event 3
]x_test_data_2 = x_test_data_1
y_test_data_2 = [[[2, 1], [4, 3], [6, 5]], event 1
[[2,1], [4, 3]], event 2
[[2,1], [4, 3], [6, 5], [8, 7]] event 3
]Define dummy callback as used by application:
def test_callback(index):
x1, y1 = x_test_data_1[index], y_test_data_1[index]
x2, y2 = x_test_data_2[index], y_test_data_2[index]signal_1_plots = [] for x,y in zip(x1, y1): signal_1 = hv.Curve((x, y), kdims=hv.Dimension('x', label='Time'), vdims=[hv.Dimension('y', label='Amplitude'),], label='Signal 1', group=f'Event {index}').opts(color='orange') signal_1_plots.append(signal_1) signal_2_plots = [] for x,y in zip(x2, y2): signal_2 = hv.Curve((x, y), kdims=hv.Dimension('x', label='Time'), vdims=[hv.Dimension('y', label='Amplitude'),], label='Signal 2', group=f'Event {index}').opts(color='purple') signal_2_plots.append(signal_2) return hv.Overlay(signal_1_plots + signal_2_plots).opts(xlim=(0, 10), ylim=(0, 10), legend_position='bottom_right')Create DynamicMap
test_slider = pn.widgets.IntSlider(start=0, end=len(x_test_data_1)-1, value=0, name=‘Event’)
plot = hv.DynamicMap(test_callback, streams={‘index’: test_slider})
pn.Column(test_slider, plot)
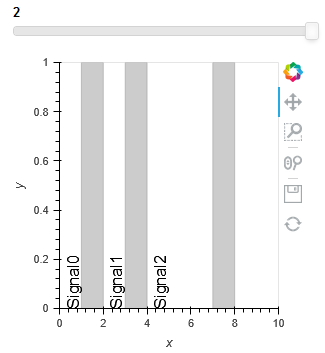
Plotting less or more objects breaks the legend (sorry I wanted to attache more images but I am not allowed as a new user):
I am not sure if this can be considered a bug or an unwanted side effect due to a mistake from my side. I am open for any suggestion. Thanks a lot.
Maybe some more context about the application:
I am working on an experiment in antiparticle physics and I am currently trying to replace our current interactive event display which is based on bokeh with a new one using holoviews. In general our detector produces two types of different signals which can occur within a single event. The number of signals per type per event can vary.