I’m trying out the new dynamical.org HRRR data on AWS, and while I can get an image plot with CRS to work, the quadmesh isn’t working correctly.
I’m guessing there is something hvplot doesn’t like about their 2D longitude, latitude arrays, but the CF convention units look okay and so does the bounding box, so I’m stumped!
Here’s a reproducer:
import icechunk
import xarray as xr
import hvplot.xarray
storage = icechunk.s3_storage(bucket="dynamical-noaa-hrrr",
prefix="noaa-hrrr-forecast-48-hour/v0.1.0.icechunk/",
anonymous=True,
region='us-west-2')
repo = icechunk.Repository.open(storage)
session = repo.readonly_session("main")
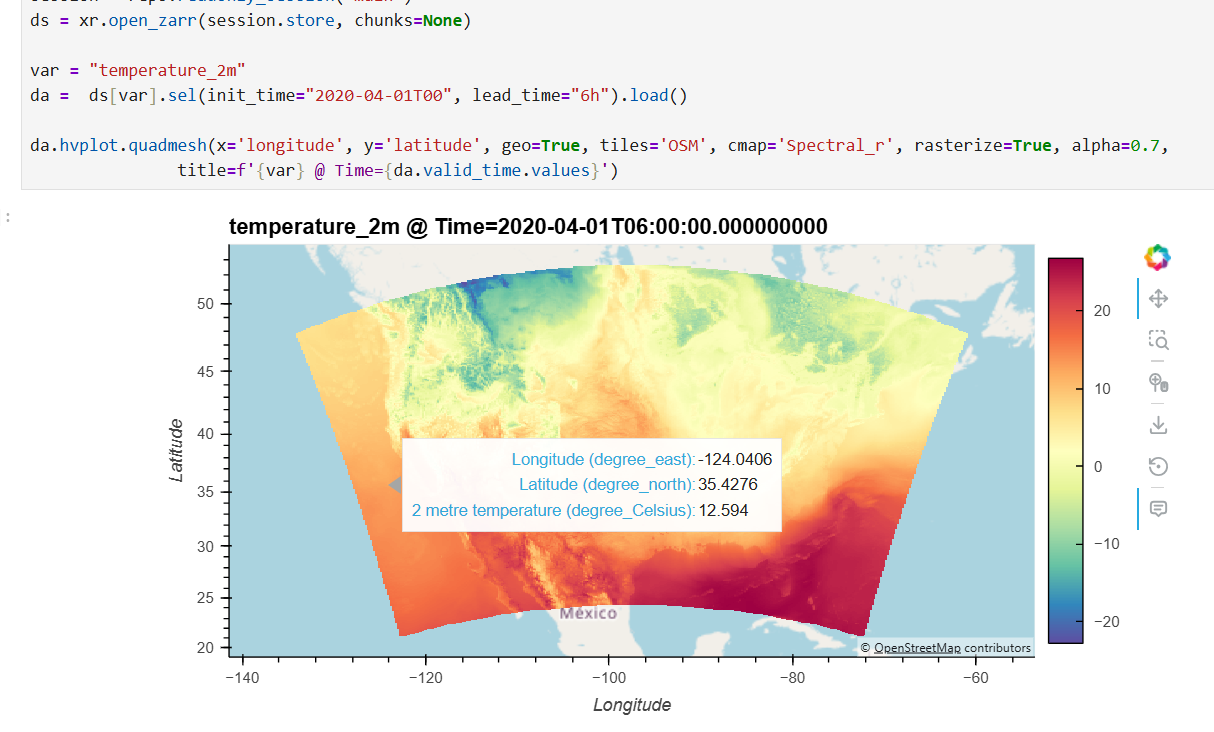
ds = xr.open_zarr(session.store, chunks=None)
var = "temperature_2m"
da = ds[var].sel(init_time="2020-04-01T00", lead_time="6h").load()
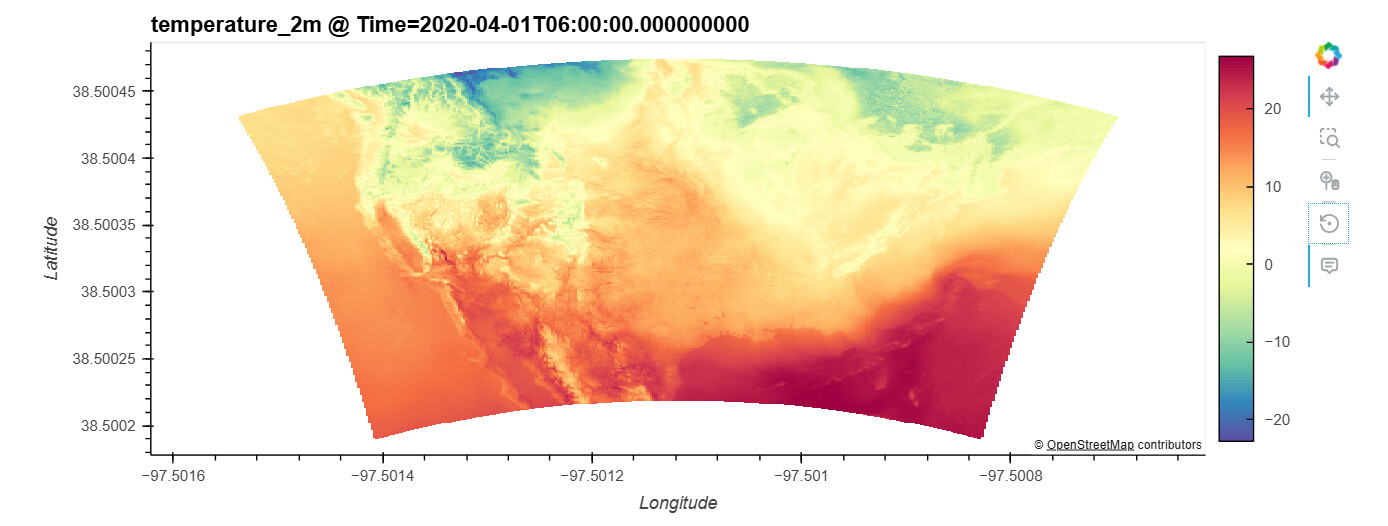
da.hvplot.quadmesh(x='longitude', y='latitude', geo=True, tiles='OSM', cmap='Spectral_r', rasterize=True, alpha=0.7,
title=f'{var} @ Time={da.valid_time.values}')
produces:
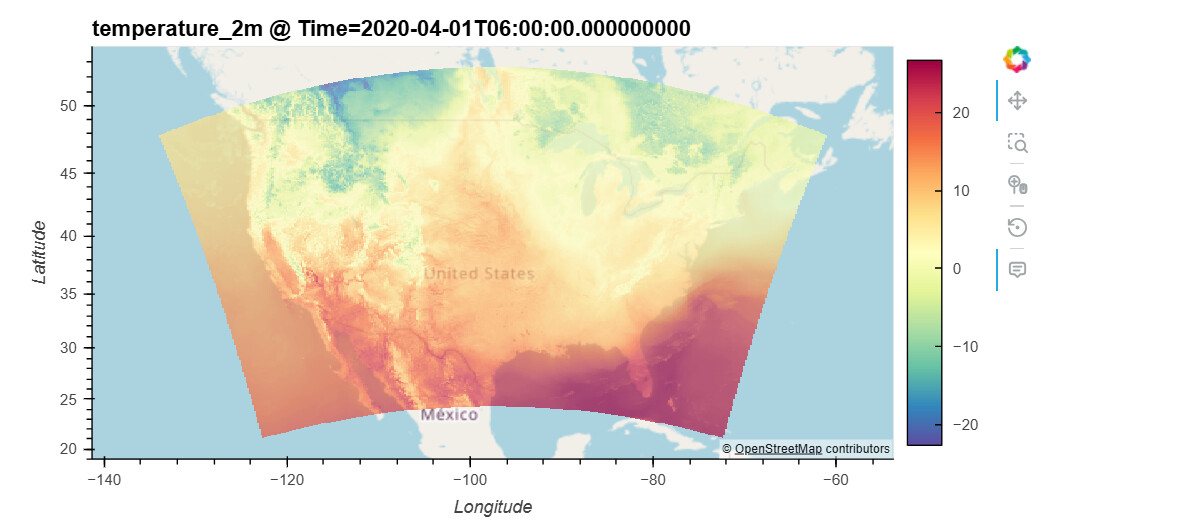
while if we use image with CRS, it’s okay:
da.hvplot.image(x='x', y='y', geo=True, tiles='OSM', crs=ds.rio.crs, cmap='Spectral_r', rasterize=True, alpha=0.7,
               title=f'{var} @ Time={da.valid_time.values}')
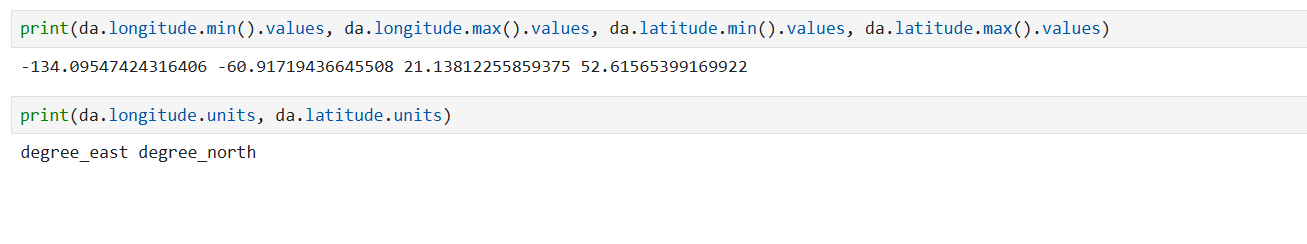
I checked the units and bounds and they seem fine:
what seems to be the problem here!? 
@ahuang11 do you see the issue?
Unless you supply a CRS hvPlot still assumes the coordinates to be Mercator. I think at some point we had considered detecting lat/lon and auto-convert them (without pulling in the complexity of geoviews and CRSs) but I’m not sure on the status of that and if it works with e.g. xarray objects.
@philippjfr , I don’t understand. I do the above all the time with other datasets and it works fine. What exactly are you suggesting?
You are totally correct I missed the geo=True part, not sure why the inference fails here. Will take a look in the morning.
Phew! I’m relieved. I was worried I was having a “senior moment”. 
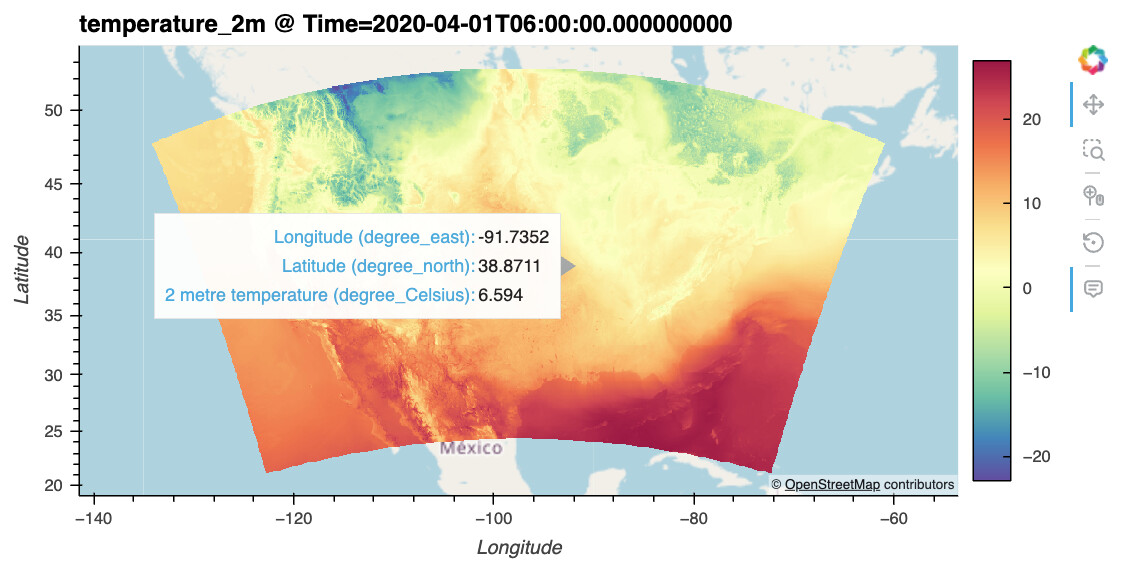
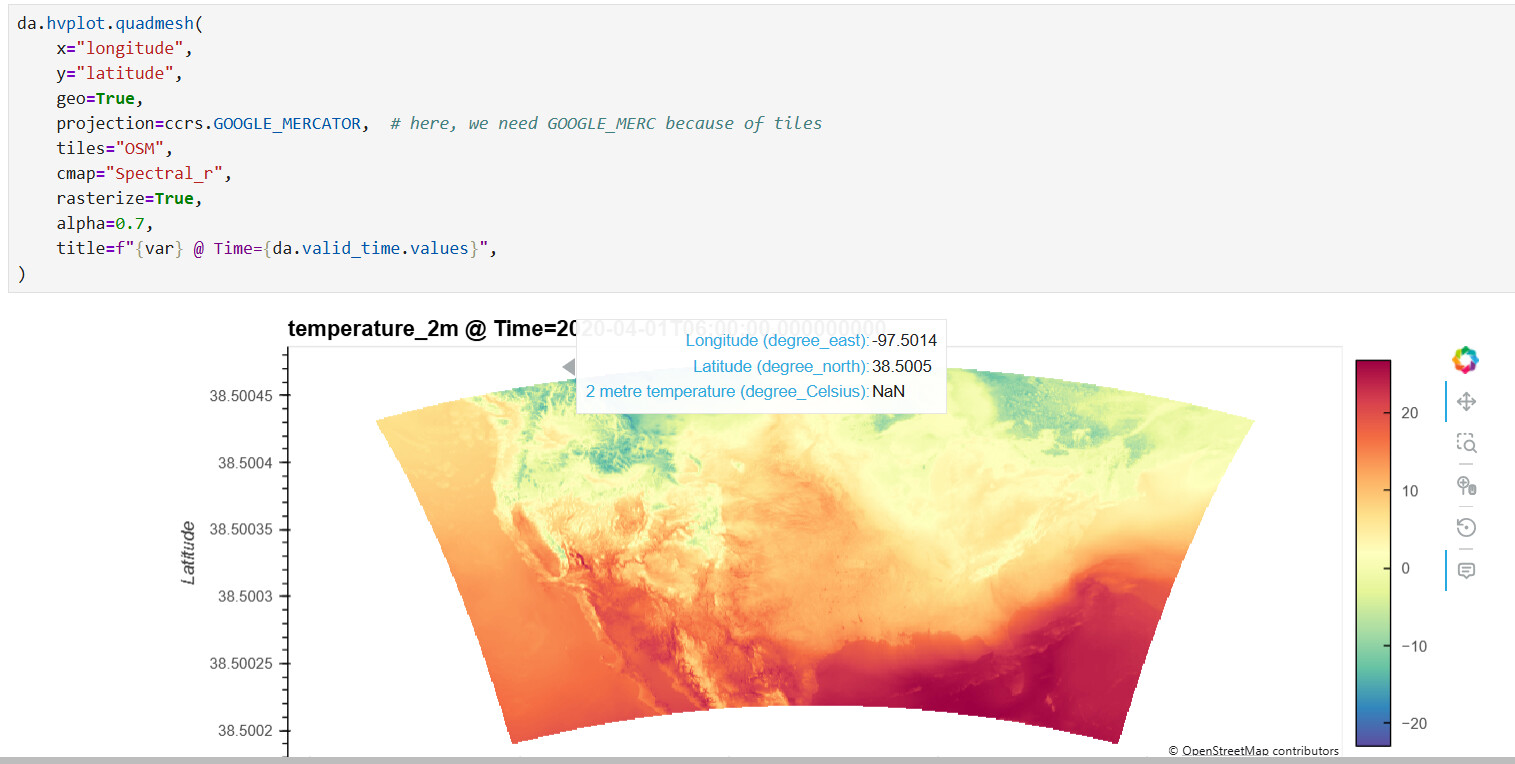
Best practice is to just always specify crs (here implicitly with geo=True) and projection
da.hvplot.quadmesh(
    x="longitude",
    y="latitude",
    geo=True,
    projection=ccrs.GOOGLE_MERCATOR,  # here, we need GOOGLE_MERC because of tiles
    tiles="OSM",
    cmap="Spectral_r",
    rasterize=True,
    alpha=0.7,
    title=f"{var} @ Time={da.valid_time.values}",
)
geoviews inference of when to set projection probably didn’t work as expected
@ahuang11 I tried that invocation and instead of your correct plot, I got the same incorrect plot back:
So I guess I must have different package versions, right?
I have:
$ conda list | grep -E "datashader|holoviews|geoviews|panel|hvplot|bokeh"
bokeh                     3.8.1              pyhd8ed1ab_0    conda-forge
datashader                0.18.2             pyhd8ed1ab_0    conda-forge
geoviews                  1.15.0               hd8ed1ab_0    conda-forge
geoviews-core             1.15.0             pyha770c72_0    conda-forge
holoviews                 1.22.1             pyhd8ed1ab_0    conda-forge
hvplot                    0.12.2             pyhd8ed1ab_0    conda-forge
jupyter_bokeh             4.0.5              pyhd8ed1ab_1    conda-forge
panel                     1.8.5              pyhd8ed1ab_0    conda-forge
my versions:
bokeh                     3.8.2                    pypi_0    pypi
datashader                0.18.2                   pypi_0    pypi
geoviews                  1.15.1                   pypi_0    pypi
holoviews                 1.22.1                   pypi_0    pypi
hvplot                    0.12.2                   pypi_0    pypi
jupyter-bokeh             4.0.5                    pypi_0    pypi
panel                     1.8.7                    pypi_0    pypi
I suspect geoviews is off by a micro version
Yep. I upgraded everything to the latest conda-forge packages:
$  conda list | grep -E "datashader|holoviews|geoviews|panel|hvplot|bokeh"
bokeh                     3.8.2              pyhd8ed1ab_0    conda-forge
datashader                0.18.2             pyhd8ed1ab_0    conda-forge
geoviews                  1.15.1             pyhd8ed1ab_0    conda-forge
geoviews-core             1.15.1             pyha770c72_0    conda-forge
holoviews                 1.22.1             pyhd8ed1ab_0    conda-forge
hvplot                    0.12.2             pyhd8ed1ab_0    conda-forge
jupyter_bokeh             4.0.5              pyhd8ed1ab_1    conda-forge
panel                     1.8.7              pyhd8ed1ab_0    conda-forge
and it worked just as I originally tried it (e.g. even without setting projection):