All the suplot examples are with the same color, and using cmap, or color parameters have no effect?
Is there an easier way to modify subplot colors?
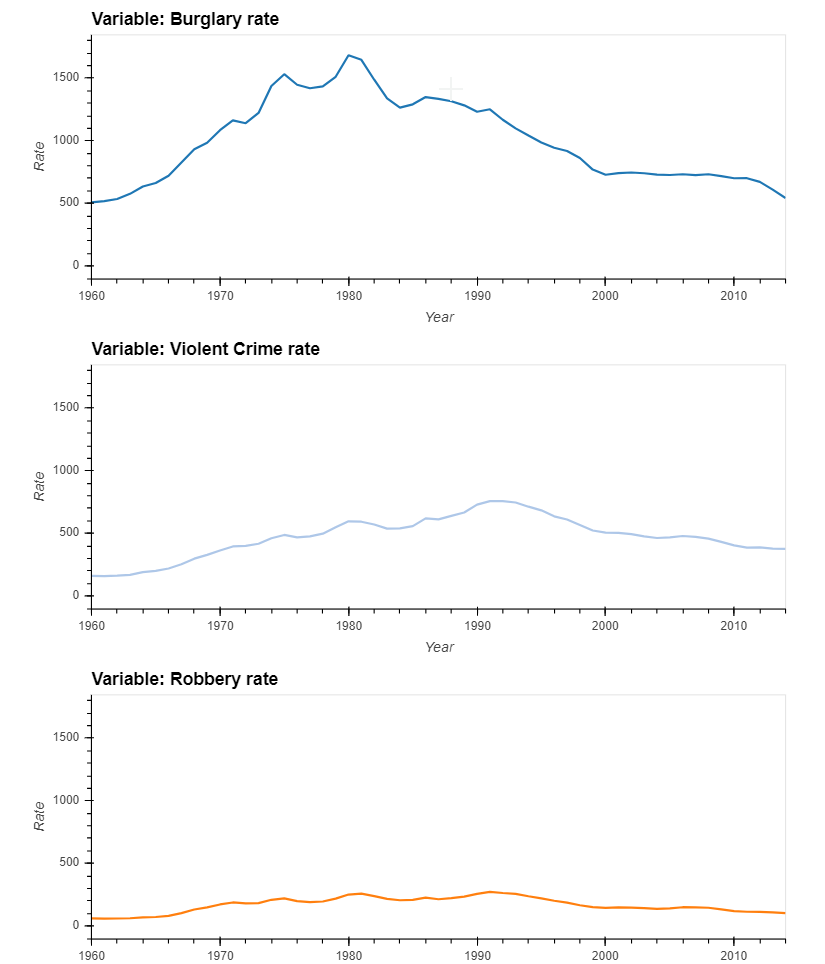
subs = us_crime.hvplot(x='Year', y=['Burglary rate', 'Violent Crime rate', 'Robbery rate'], value_label='Rate',
                color=hv.Cycle('Category20'), cmap=hv.Cycle('Category20'), subplots=True)

for i, sub in  enumerate(subs.keys()):
    subs[sub].opts(color=hv.Cycle('Category20').values[i%20])
subs.cols(1)