Tabs disappearing when switching

Hey
I’ve got a program that loads plotly plots (box/bar and 3Dscatter) into multiple nested tabs.
The default plotly sizing_mode is set to stretch_width
and the autosize in plotly is set to True.

I have a few problems with these tabs:

  1. The plots are shown in a small width (not autosized) and only updated to fit the page after ~1 second… this happens on each tab on the first time I enter it.
  2. Some of the nested tabs load not full width and then the plots are not shown
    image
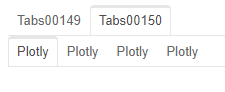
    This is “fixed” after switching to another tab and going back to this one…
  3. tabs disappear after switching from tab to tab (for example when clicking on the second one, the first tab disappears)
  4. Some plots appear without stretch_width and without autosize and only after pressing the autorange button on the plotly menu, it is updated

can anyone help with any of the above issues? :slight_smile:

1 Like

Hi @alon-sht

I’m sure someone can. But you would need to post a minimum reproducible example for some one to be able to help on the right problem.

If you believe these are bugs please post as bugs on Github with the minimum reproducible example. If you believe its more a problem of using the code in the right way please post below.

Thanks.

@alon-sht they have been quite a number of issues with resizing plotly plots in tabs indeed! @philippjfr has improved that a lot recently so I’d suggest, if it’s not already the case, to try with the latest version of Panel.

2 Likes

I have tried to update to the latest version, but having trouble with the hover box
In the middle of the plot it doesnt work, just on the left and right 20% for some reason…
This is a critical issue for me since i mostly rely on hover info.
Instead I use version 0.12.4…

Here is a reproducible example for most of my issues:
import plotly.express as px
import panel as pn
import pandas as pd
import numpy as np
pn.extension()
box_tabs=pn.Tabs()
scatter_tabs=pn.Tabs()
df=pd.DataFrame(np.random.randint(1,100,size=(150,15)),columns=[‘x0’,‘y0’,‘z0’,‘x1’,‘y1’,‘z1’,‘x2’,‘y2’,‘z2’,‘x3’,‘y3’,‘z3’,‘x4’,‘y4’,‘z4’]).reset_index()
scatter_dict={}
for i in range(0,5):
scatter_dict[‘scatter_’+str(i)]=px.scatter_3d(df,x=‘x’+str(i),y=‘y’+str(i),z=‘z’+str(i))
scatter_dict[‘scatter_’+str(i)].update_layout(autosize=True)
scatter_tabs.append(scatter_dict[‘scatter_’+str(i)])

box_dict={}
for i in range(0,3):
box_dict[‘box_’+str(i)]=px.box(df,x=‘x’+str(i),y=‘y’+str(i))
box_dict[‘box_’+str(i)].update_layout(autosize=True)
box_tabs.append(box_dict[‘box_’+str(i)])
main_tabs=pn.Tabs(box_tabs,scatter_tabs)
main_tabs.show()

At first all the tabs are shown, but when moving from one to another, some of them disapper (they hide on the left and cant be clicked again):
This is before moving between tabs:
image
This is after moving one tab to the right:
image

Also when moving between tabs, plots are first loaded small like that:


and only after one sec they become full page…

in one of my apps this doesnt even happen automatically, only after clicking ‘autoscale’

1 Like

Hi @alon-sht

When I run your code on Panel 0.12.6 and Plotly 5.4.0 it looks like the below.

I.e. can reconfirm

  • Some tabs disappear when a tab is clicked.
  • The plotly plots starts with one size and then resizes.

I’ve filed an issue on Github Plotly and Tabs Issue · Issue #3019 · holoviz/panel (github.com)

import plotly.express as px
import panel as pn
import pandas as pd
import numpy as np
pn.extension()
box_tabs=pn.Tabs()
scatter_tabs=pn.Tabs()
df=pd.DataFrame(np.random.randint(1,100,size=(150,15)),columns=['x0','y0','z0','x1','y1','z1','x2','y2','z2','x3','y3','z3','x4','y4','z4']).reset_index()
scatter_dict={}
for i in range(0,5):
    scatter_dict['scatter_'+str(i)]=px.scatter_3d(df,x='x'+str(i),y='y'+str(i),z='z'+str(i))
    scatter_dict['scatter_'+str(i)].update_layout(autosize=True)
    scatter_tabs.append(scatter_dict['scatter_'+str(i)])

box_dict={}
for i in range(0,3):
    box_dict['box_'+str(i)]=px.box(df,x='x'+str(i),y='y'+str(i))
    box_dict['box_'+str(i)].update_layout(autosize=True)
    box_tabs.append(box_dict['box_'+str(i)])
main_tabs=pn.Tabs(box_tabs,scatter_tabs)
main_tabs.servable()

The below code is an improvement. The tabs no longer disappear. But some kind of visible resizing of the plots still happens.

I’ve added pn.extension("plotly"), added the config={'responsive': True} argument. And wrapped the Plotly panes in Columns.

import plotly.express as px
import panel as pn
import pandas as pd
import numpy as np
pn.extension("plotly")
box_tabs=pn.Tabs()
scatter_tabs=pn.Tabs()
df=pd.DataFrame(np.random.randint(1,100,size=(150,15)),columns=['x0','y0','z0','x1','y1','z1','x2','y2','z2','x3','y3','z3','x4','y4','z4']).reset_index()
for i in range(0,5):
    scatter=px.scatter_3d(df,x='x'+str(i),y='y'+str(i),z='z'+str(i))
    scatter.update_layout(autosize=True)
    scatter_tabs.append(pn.Column(pn.panel(scatter, config={'responsive': True}), sizing_mode="stretch_both"))

for i in range(0,3):
    box=px.box(df,x='x'+str(i),y='y'+str(i))
    box.update_layout(autosize=True)
    box_tabs.append(pn.Column(pn.panel(box, config={'responsive': True}), sizing_mode="stretch_both"))
main_tabs=pn.Tabs(box_tabs,scatter_tabs)
main_tabs.servable()

I can confirm that this solution helped the disappearing tabs problem
Another problem that i mentioned that i cannot reproduce in the simple code for some reason is that the first tab is kind of “collapsed” (i see it as empty) and only after switching to another tab and then returning to the first one, the plot appears there - happens only with the 3dscatter plot (not with the box plot)
you have any solutions for that?

Another problem, also mentioned in one of the comments is that with panel 0.12.6 the hover over boxplots only works on the right and left 20% of the plot. - the whole plot is non responsive. This also appears in the example above, you can test it yourself with hover as well as zoom and other options.
This issue does not happen at 0.12.4. (plotly 5.4.0)