Hi
I am trying to learn more about using Tabulator.
- Adding Rows
Are there any best practices with regard to adding data row
I am currently thinking about adding rows to the dataframe and rendering the table again?
I would like to keep both the dataframe and the table in sync - as i run some background computation with the values in the dataframe while taking user input in the table.
From my understanding this is slightly different from streaming and patching - the former changes the dataframe and appends new data to tabulator, the latter updates the tabulator but doesnt touch the dataframe. Alternately, I could update the dataframe as a separate step and patch the table thereby keeping both in sync.
Another possible answer is in this thread https://github.com/holoviz/panel/issues/3028 - using Param
However, I am unable to pass “configuration” when creating the custom view widget using tabulator.
import param
import pandas as pd
import panel as pn
pn.extension('tabulator')

class Example(param.Parameterized):

    stats = param.DataFrame()

    dataframe = param.DataFrame(pd._testing.makeDataFrame())

    @property
    def view(self):
        return pn.widgets.Tabulator.from_param(self.param.dataframe, pagination = 'local',
                                               configuration={"headerSort": False, "resizableColumns": False})

e = Example()
e.view
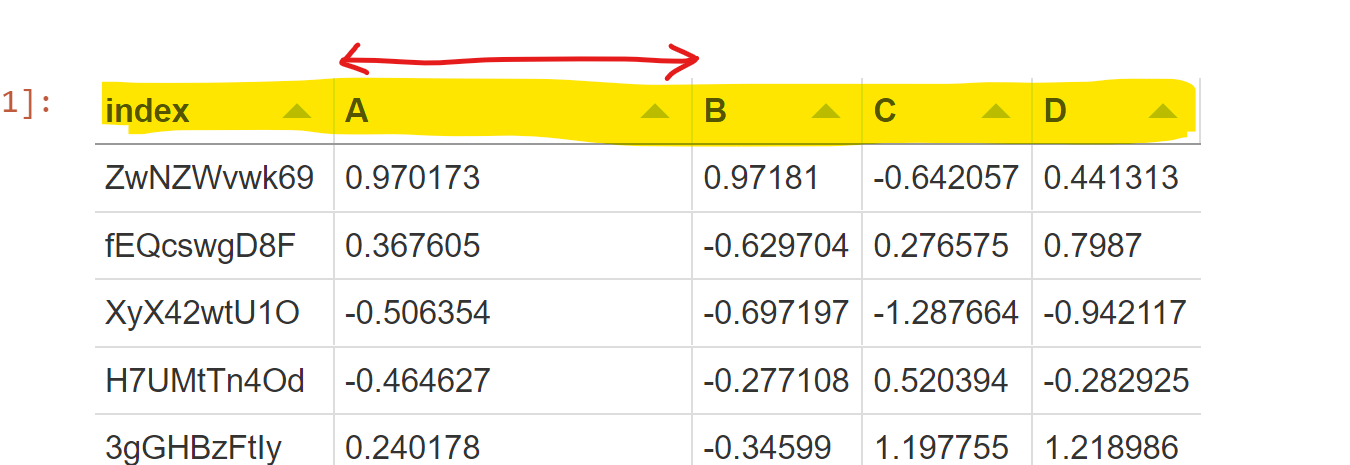
As you can see the configuration dict did not apply to the widget as both the headerSort and resizeableColumns are set to True in the screenshot
- MovableRows
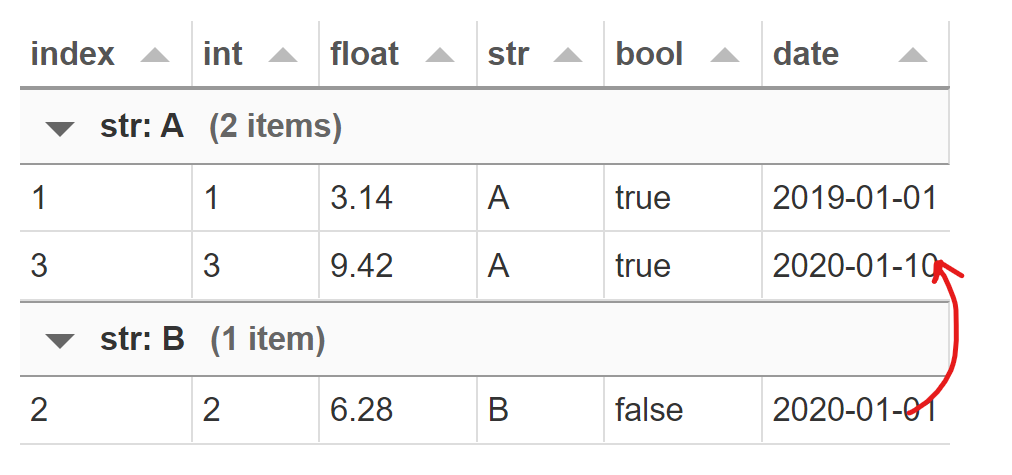
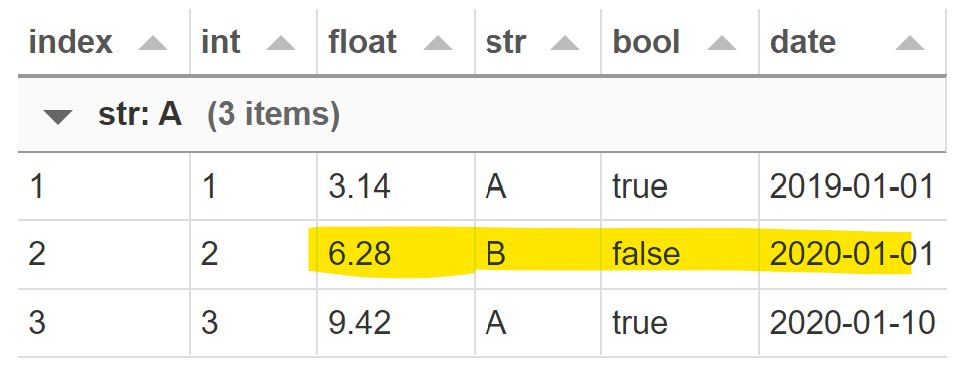
I was able to construct a Tabulator with movableRows using the configuration option. But the movement of the rows doesn’t seem to change the data dynamically as it does here - Tabulator (movable rows with rowgroups). I am able to use the groupby argument to group the data, but moving the data between the groups does not change the data to reflect to that group
df = pd.DataFrame({
    'int': [1, 2, 3],
    'float': [3.14, 6.28, 9.42],
    'str': ['A', 'B', 'A'],
    'bool': [True, False, True],
    'date': [dt.date(2019, 1, 1), dt.date(2020, 1, 1), dt.date(2020, 1, 10)]
}, index=[1, 2, 3])

table_config = {'movableRows': True}

df_widget = pn.widgets.Tabulator(df, groupby=['str'], height=400, configuration = table_config)
df_widget
Is this expected behavior? Is there a way to make this work like it does in JS?