I am trying to style my Tabulator row background color based on the different values of the column Category in my data frame, but no luck. Can anyone here help? Thank you. Here is the example code I ran:
import pandas as pd
import panel as pn
pn.extension('tabulator')
# Sample DataFrame
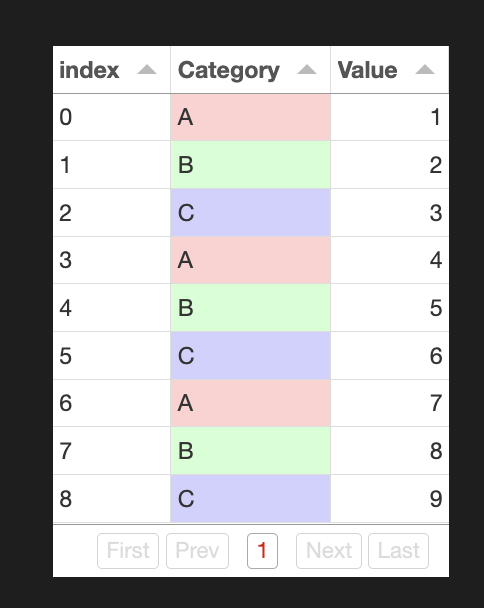
data = {'Category': ['A', 'B', 'C', 'A', 'B', 'C', 'A', 'B', 'C'],
'Value': [1, 2, 3, 4, 5, 6, 7, 8, 9]}
df = pd.DataFrame(data)
# Assuming `df` is your DataFrame and it has a column named 'Status' which determines the color of the row
# Define a function to apply the style based on the 'Status' column value
def style_rows(row):
if row['Category'] == 'A':
return ['background-color: #FFD1D1'] # Light red
elif row['Category'] == 'B':
return ['background-color: #D1FFD1'] # Light green
elif row['Category'] == 'C':
return ['background-color: #D1D1FF'] # Light blue
return [''] # Default no background
# Apply the style to the DataFrame
styled_df = df.style.apply(style_rows, axis=0)
# Create the Tabulator widget using the styled DataFrame
tabulator = pn.widgets.Tabulator(styled_df, pagination='local', page_size=10)
# Show the Tabulator widget in a Panel app
tabulator.servable()
Thanks. I have tried all this, to no avail. Can you modify the code I provided so I could try it out please? The documentation has not being very helpful.
import pandas as pd
import panel as pn
pn.extension('tabulator')

# Sample DataFrame
data = {'Category': ['A', 'B', 'C', 'A', 'B', 'C', 'A', 'B', 'C'],
        'Value': [1, 2, 3, 4, 5, 6, 7, 8, 9]}
df = pd.DataFrame(data)

# Assuming `df` is your DataFrame and it has a column named 'Status' which determines the color of the row
# Define a function to apply the style based on the 'Status' column value
def style_rows(row):
    print(row)
    if row == 'A':
        return ['background-color: #FFD1D1']  # Light red
    elif row == 'B':
        return ['background-color: #D1FFD1']  # Light green
    elif row == 'C':
        return ['background-color: #D1D1FF']  # Light blue
    return ['']  # Default no background

# Apply the style to the DataFrame
styled_df = df.style.applymap(style_rows)

# Create the Tabulator widget using the styled DataFrame
tabulator = pn.widgets.Tabulator(styled_df, pagination='local', page_size=10)

# Show the Tabulator widget in a Panel app
tabulator.servable()