Target plot in RangeToolLink does not update when using datashade

I’m wondering if I’m doing something wrong or if this is a bug?

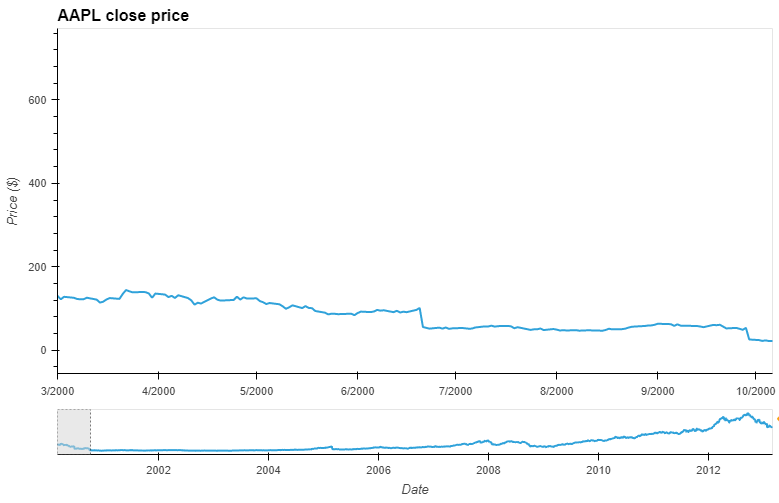
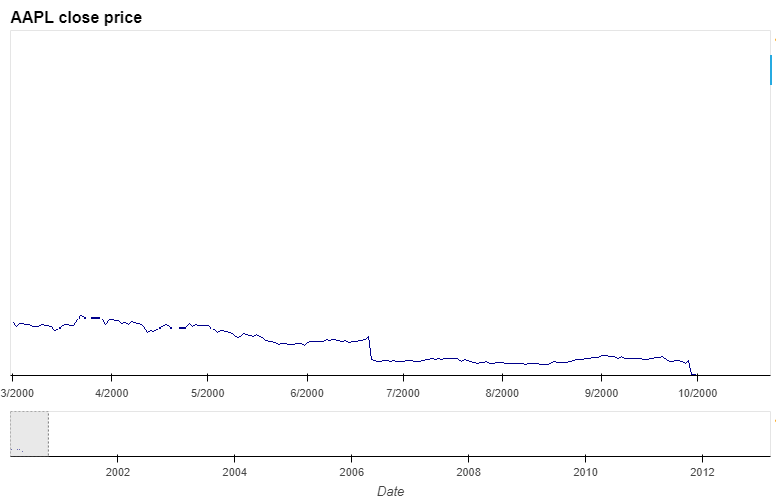
I am following the example from the Holoviz website, but I have modified it to include datashade. When I zoom in on the chart, using the source chart, the target chart does not update - it scrolls but the datashade never updates the bitmap.

import pandas as pd
import holoviews as hv
from holoviews import opts

from holoviews.plotting.links import RangeToolLink

hv.extension('bokeh')

# Need to do this once
#import bokeh
#bokeh.sampledata.download()

import holoviews.operation.datashader as hd
from bokeh.sampledata.stocks import AAPL

aapl_df = pd.DataFrame(AAPL['close'], columns=['close'], index=pd.to_datetime(AAPL['date']))
aapl_df.index.name = 'Date'

aapl_curve = hv.Curve(aapl_df, 'Date', ('close', 'Price ($)'))
aapl_curve = hd.datashade(aapl_curve)

tgt = aapl_curve.relabel('AAPL close price').opts(width=800, height=400, labelled=['y'], toolbar='disable')
src = aapl_curve.opts(width=800, height=100, yaxis=None, default_tools=[])

RangeToolLink(src, tgt)

layout = (tgt + src).cols(1)
layout.opts(opts.Layout(shared_axes=False, merge_tools=False))

Version doesn’t seem to matter, but I’m running:
python 3.9.13
holoviews 1.15.0
datashader 0.14.2
pandas 1.4.3
bokeh 2.4.3

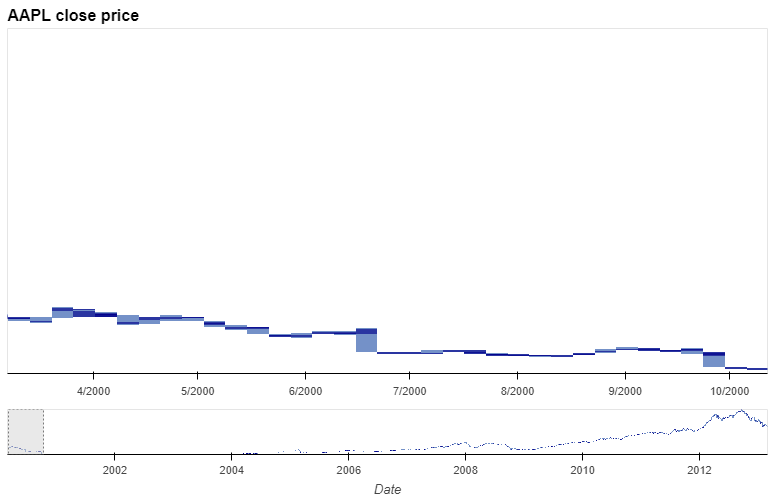
Here is what it looks like when I zoom in with datashade:

Versus what I get when I run the example as it appears on the website:

Finally, this is what I get if I turn the toolbar back on and do a slight drag to force datashade to do the update (this is the expected result):

I think this is the same bug as mentioned here.

It should be fixed in the next release of holoviews.

1 Like

Yes, thank you. Downgrading to holoviews 1.14.9 results in the proper behavior.

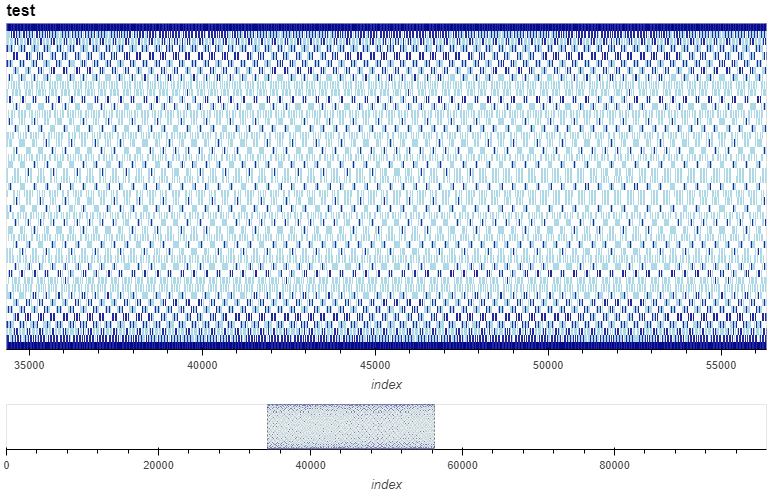
Actually I think there still might be a problem. Datashade updates both the target and source plots, which results in only partial display of the data in the lower plot. This wasn’t obvious with the AAPL data because of the tiny size of the line, but if I change to dense data, it is very blatant:

The plot looks weird. Do you have an MRE (or data) to reproduce it?

If there is a bug, it can first really be investigated after the bug I mentioned above is fixed.

Oh, the plot is just dummy sine waves. I just wanted to fill the lower bar so it would be more obvious. I’m happy to provide the code.

import holoviews as hv
hv.extension('bokeh')
import numpy as np
import pandas as pd
import holoviews.operation.datashader as hd

# Make about 100k points
X = np.arange(100000)
sin = np.sin(X)
cos = np.cos(X)
df = pd.DataFrame(np.array([sin,cos]).T, columns=['sin', 'cos'], index=X)
df = df.reset_index()

def return_scatter(x_col, y_col):
    scatter = hv.Scatter(df, kdims=x_col, vdims=y_col)
    scatter = hd.datashade(scatter, width=800, height=400, x_range=(df[x_col].min(), df[x_col].max()))
    tgt = scatter.relabel('test').opts(width=800, height=400, toolbar='disable', axiswise=True)
    src = scatter.opts(width=800, height=100, yaxis=None, default_tools=[])
    hv.plotting.links.RangeToolLink(src, tgt)
    layout = (tgt + src).cols(1)
    return layout.opts(hv.opts.Layout(shared_axes=False, merge_tools=False))

return_scatter('index', 'sin')