How do I get the tooltips to render?
DeckGL — Panel v1.6.2 only shows an example with a geojson.
import panel as pn
import random
pn.extension('deckgl')
MAPBOX_KEY = ""
if MAPBOX_KEY:
map_style = "mapbox://styles/mapbox/dark-v9"
else:
map_style = "https://basemaps.cartocdn.com/gl/dark-matter-gl-style/style.json"
df = pd.read_csv("https://raw.githubusercontent.com/uber-common/deck.gl-data/master/examples/3d-heatmap/heatmap-data.csv")
df["z"] = df["lat"] / random.randint(1, 3000)
json_spec = {
"initialViewState": {
"bearing": -27.36,
"latitude": 52.2323,
"longitude": -1.415,
"maxZoom": 15,
"minZoom": 5,
"pitch": 40.5,
"zoom": 6
},
"layers": [{
"@@type": "HexagonLayer",
"autoHighlight": True,
"coverage": 1,
"data": df,
"elevationRange": [0, 3000],
"elevationScale": 50,
"extruded": True,
"getPosition": "@@=[lng, lat]",
"getElevationWeight": "@@=z",
"id": "8a553b25-ef3a-489c-bbe2-e102d18a3211",
"pickable": True
}],
"mapStyle": map_style,
"views": [
{"@@type": "MapView", "controller": True}
]
}
tooltips = {
"html": """
<div>
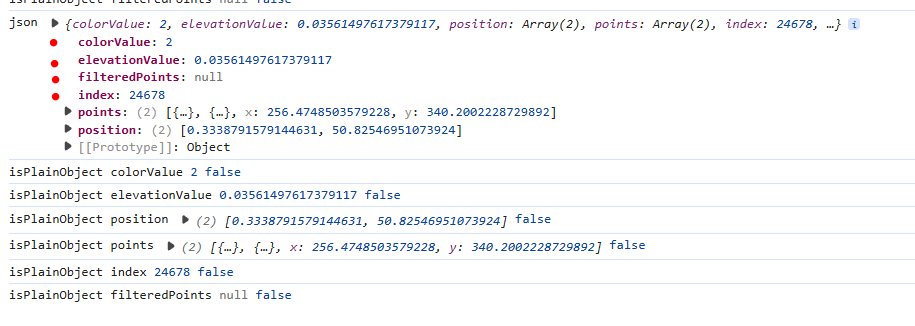
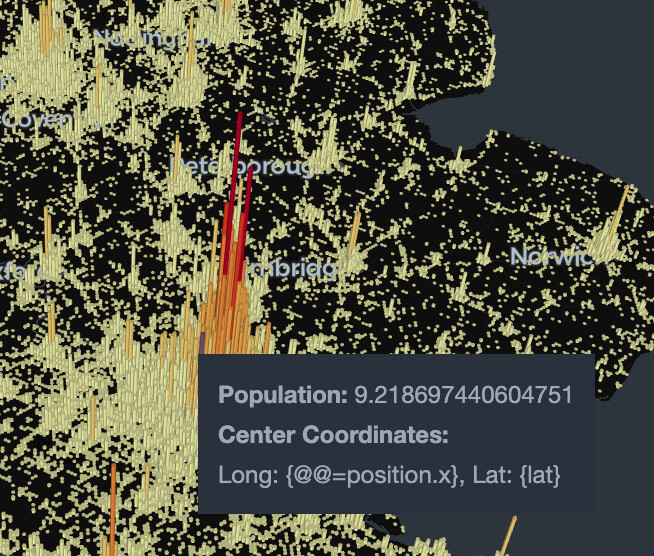
<b>Population:</b> {elevationValue}<br/>
<b>Center Coordinates:</b><br/>
Long: {@@=position.x}, Lat: {lat}
</div>
""",
}
deck_gl = pn.pane.DeckGL(json_spec, mapbox_api_key=MAPBOX_KEY, sizing_mode='stretch_width', height=600, tooltips=tooltips)
deck_gl.show()