Hello,
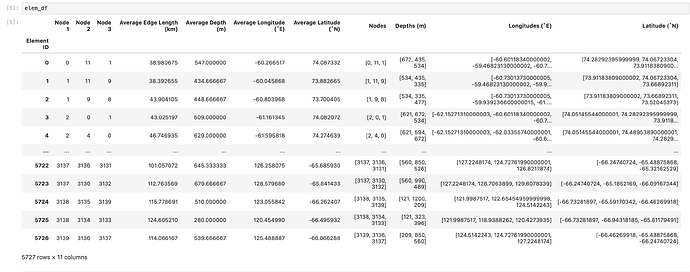
I’m trying to get a Trimesh working from 2 pandas data frames. One describes the elements (simplifies, triangles) the other describes the nodes (vertexes). Here is what they look like:
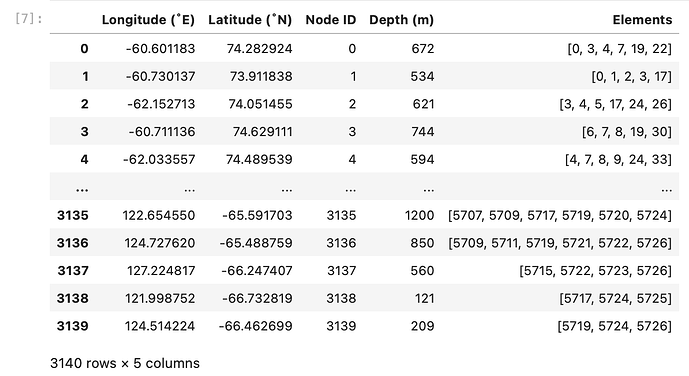
And for Nodes:
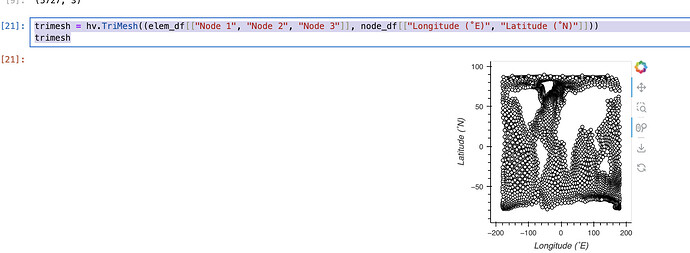
So, lots of information, and everything is organised. Here is the minimised example of what I have for plotting:
trimesh = hv.TriMesh((elem_df[["Node 1", "Node 2", "Node 3"]], node_df[["Longitude (˚E)", "Latitude (˚N)"]]))
trimesh
Super simple.
Now the question is: how do I add hover information and color? I’ve seen approaches that use rasterize, but that makes the hover tool limited, from what I have seen. Any hint would be greatly appreciated!
Cheers,
Paul


