I am trying to plot features on a map, and wanted to add province/state borders on my plot of North America, but I can’t seem to get it to work properly. I can download the borders using cartopy, and I wrap it in a geoviews.Feature, but when I go to plot it, only the state borders for USA show up on the plot. I expected the province borders for Canada to appear in my map.
I loosely followed the user guide on plotting geometries from Geometries — GeoViews v1.9.6. Maybe I am using the wrong group= argument when I convert the object into a geoviews.Feature?
import geoviews as gv
import geoviews.feature as gf
from geoviews import opts
from cartopy import crs, feature as cf

gv.extension('bokeh')

# Download state/province borders with cartopy
provinces = cf.NaturalEarthFeature(category='cultural',
    name='admin_1_states_provinces_lines', scale='50m', facecolor='none')

# Other features from geoviews
features = gv.Overlay([gf.ocean, gf.land, gf.rivers, gf.lakes, gf.borders, gf.coastline])

# Set the projection
mapproj = crs.PlateCarree()

# Plot the map
(features * gv.Feature(provinces, group='Lines')).opts(
    projection=mapproj,
    width=800,
    height=600,
    xlim=(-178, -49),
    ylim=(6.6, 83.3))
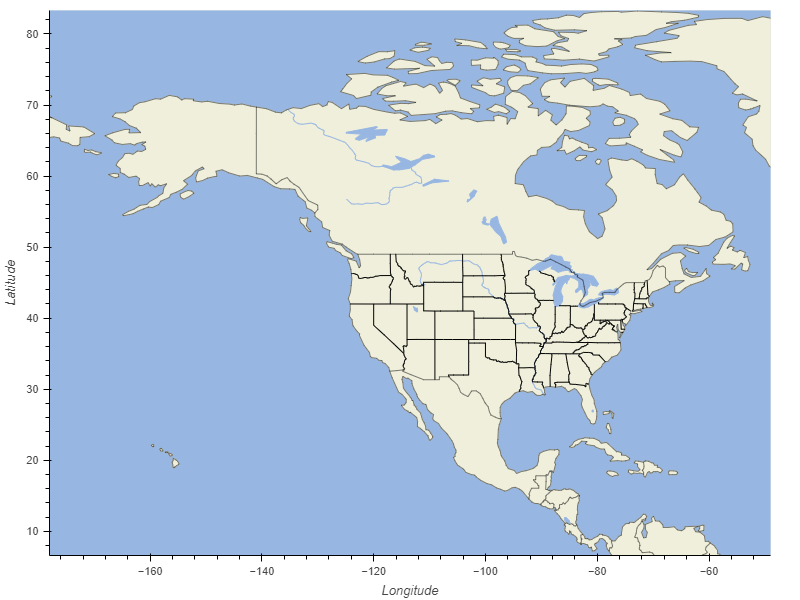
It seems like when I try to plot the state/province borders with gv.Feature(provinces), it only plots the American state borders and then just stops.
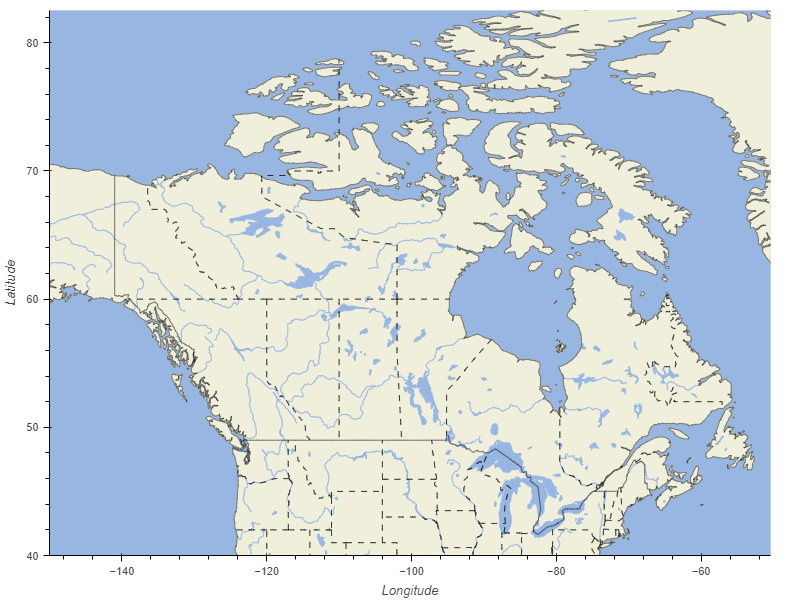
I know that cartopy state/province borders are there, because if I plot a similar map using just cartopy and matplotlib, I can get the borders to show up! (See this StackOverflow answer for code: function - Adding Provinces to Canadian Map in Python Cartopy - Stack Overflow)