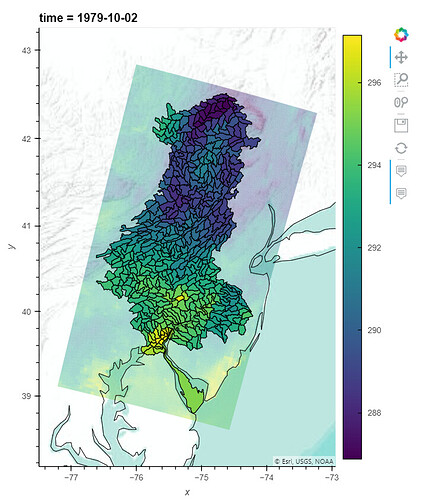
Is it possible to turn individual plots in a stacked plot, ie plot1 * plot2, with a resulting button (such as the hover button, but a checkbox) to turn one or the other off and on? If so is there an example I could be pointed to? Thanks for any help.
Could something like this maybe be adapted?
Thanks Carl - I’ll give that a try!
