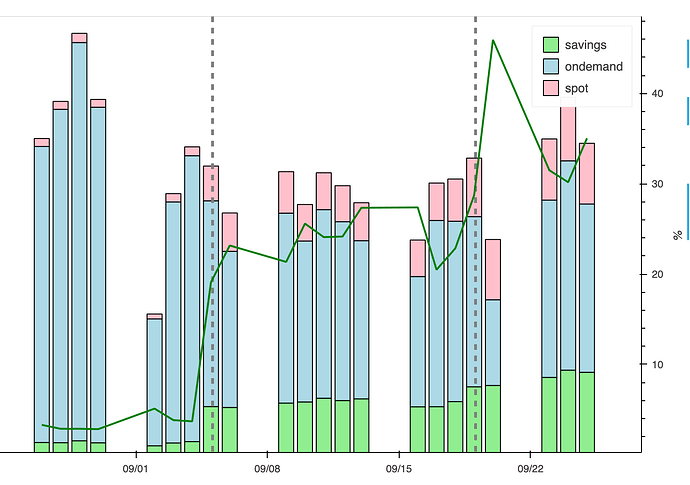
I’ve got an overlay showing some bars, and a curve on the twin axis. Looks good, except that for whatever reason, the curve is not showing on the legend? The bars are
Partial screenshot:
IMO it’s kind of unclear what the green line is without it.
I tried adding another curve, thinking maybe it doesn’t do legend items when there’s just one of them, but that didn’t help
Partial code:
savings_pct_curve = hv.Curve(savings_pct_tidy*100).opts(ylabel="%")
savings_pct_curve.opts(color="green", tools=["hover"])
spend_bars = hv.Bars(spend_sums_tidy, kdims=[hv.Dimension("start"), "type"], vdims=["spend"])
spend_bars.opts(stacked=True, tools=["hover"], color=hv.Cycle(["lightgreen", "lightblue", "pink"]))

overlay = hv.Overlay([
    spend_bars,
    deploys_lines,
    savings_pct_curve,
  ]).opts(
    opts.Overlay(
        responsive=True, height=500, xlabel='', ylabel="$k", multi_y=True,
        yformatter=bokeh.models.formatters.CustomJSTickFormatter(
            code='''return tick/1000;'''
        ),
    ),
)
show(hv.render(overlay))

