Hi There,
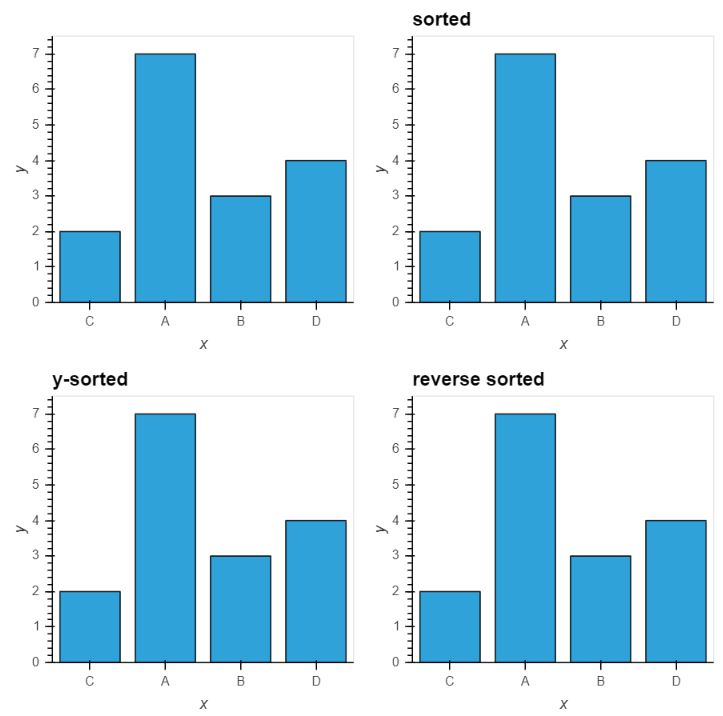
Could someone please help me understand how is the sorting achieved in Bar graphs in the example mentioned in Tabular_Datasets of Holoviews.org?
I see all the graphs are same even after applying the sorting mechanism.
http://holoviews.org/user_guide/Tabular_Datasets.html
hv.output(backend=‘bokeh’)
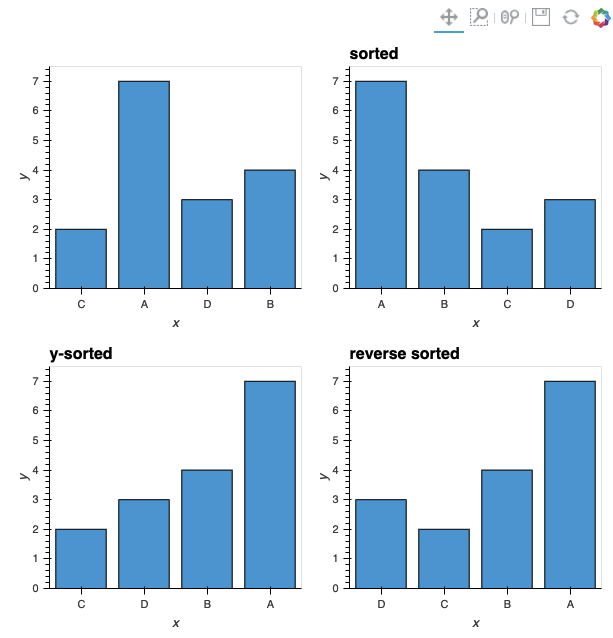
bars = hv.Bars(([‘C’, ‘A’, ‘B’, ‘D’], [2, 7, 3, 4]))
(bars +
bars.sort().relabel(‘sorted’) +
bars.sort([‘y’]).relabel(‘y-sorted’) +
bars.sort(reverse=True).relabel(‘reverse sorted’)).cols(2)
Thank you for your time!
Thanks,
Dilip